“The annual shareholder letters and earning transcripts are the true windows into a company’s performance. Words matter. By analyzing the language used by management during these communications, we can gauge their honesty, transparency, and long-term thinking. It’s not just about the numbers; It’s about understanding the narrative behind them and how it can impact the company’s revenue and stock price.”- Warren Buffett, Chairman and CEO of Berkshire Hathaway
“This is a day I’ve been looking forward to for two and a half years. Every once in a while, a revolutionary product comes along that changes everything…” These were the opening remarks of Steve Jobs at the 2007 annual earnings conference call that saw him announce the launch of a revolutionary product that combines a phone, an iPod, and an internet communication device in one. This was the speech that led to the birth of the iPhone.
After this speech on January 9, 2007, Apple’s stock price grew consistently from January to December 2007. Similar to the release of a revolutionary product like the iPhone was the release of the Model S by Tesla in the summer of 2012.
At the time of the Model S release, Tesla was still a relatively young company, known primarily for its high-end electric sports car, the Tesla Roadster. However, the Model S represented a pivotal moment for Tesla, as it was the company’s first mass-produced electric vehicle designed for a broader consumer market.
The Model S boasted impressive features such as long-range capabilities, sleek design, advanced technology, and exceptional performance. It received rave reviews from critics and enthusiasts alike, who praised its driving experience, range, and innovative features such as the large touchscreen interface and over-the-air software updates. The positive reception of the Model S translated into a surge in Tesla’s stock price. Within a month of the Model S release, Tesla’s stock price increased by over 50%.
At Data Products LLC, we embarked on a research journey to verify the validity of a hypothesis. We wanted to find out if and or how technology terms mentioned in earnings transcripts affect the organization’s revenue and stock prices over the coming weeks and months after the earnings call.
The following subsections will provide a deep understanding of the process we took to get here and also findings that we found insightful and that you will find interesting.
When we set out to build this first version of what we now call the Finscope, we wanted the data samples to be public companies from all around the world, and to get that, we selected companies on the 2022 Fortune 500 Global list. We proceeded to collect the data, which included the frequency count of technology terms such as artificial intelligence, cloud computing, blockchain, and machine learning, to mention a few in quarterly earnings reports and some financial metrics that corresponded to those quarters, such as revenue, operating income, gross profit, stock price, and net income.
We pulled transcript data from Financial Modeling Prep for our analysis. However, we initially only managed to retrieve data for 140 of the 500 public companies we had targeted. Realizing that we needed to extend the study pool for a comprehensive report, we expanded our dataset by including companies from the 2022 Fortune 500 US list.
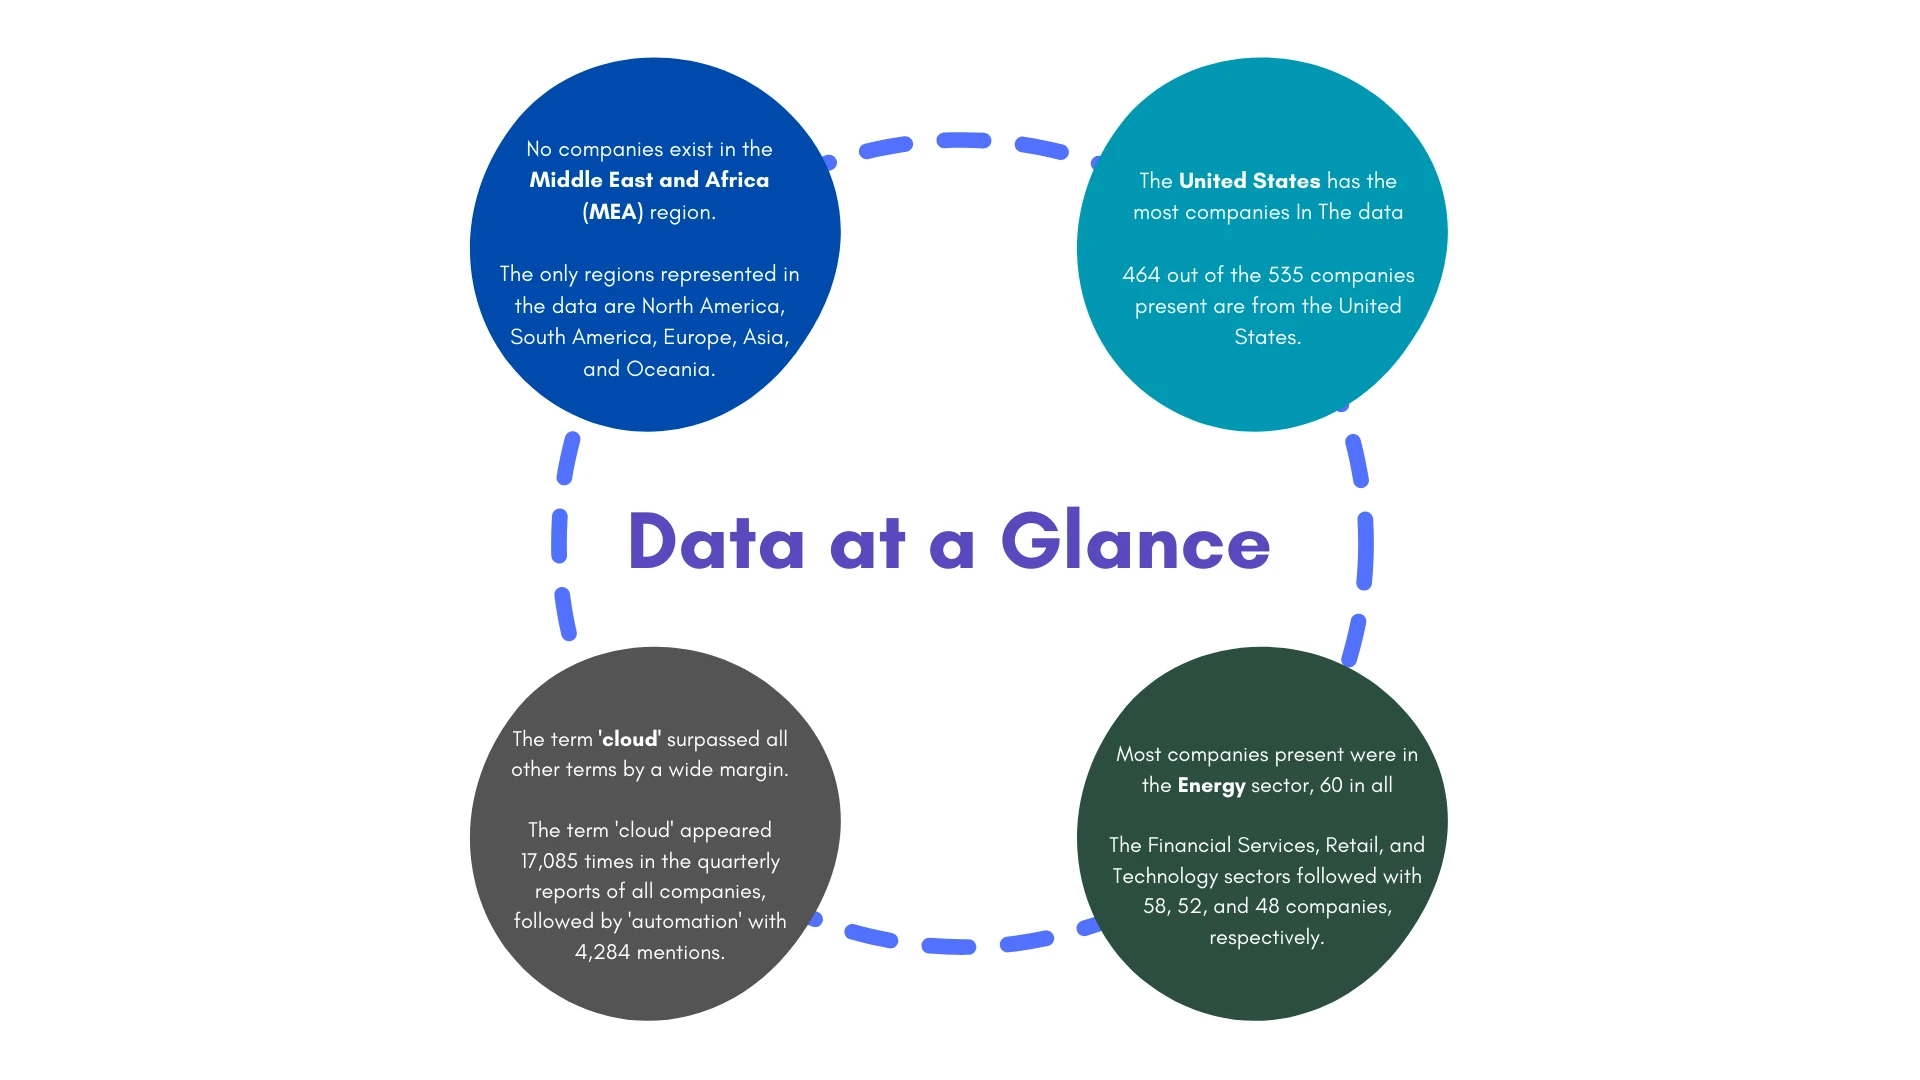
After combining these two lists and eliminating duplicate companies in both the global and US lists, 805 unique companies made up the final sample size. With this augmented dataset, we gathered data for the listed companies. Ultimately, we obtained data for approximately 535 of the 805 unique companies identified.
Here is a statistical summary of the data:
02. The Age of AI: Technology Companies Advancing The Global Front
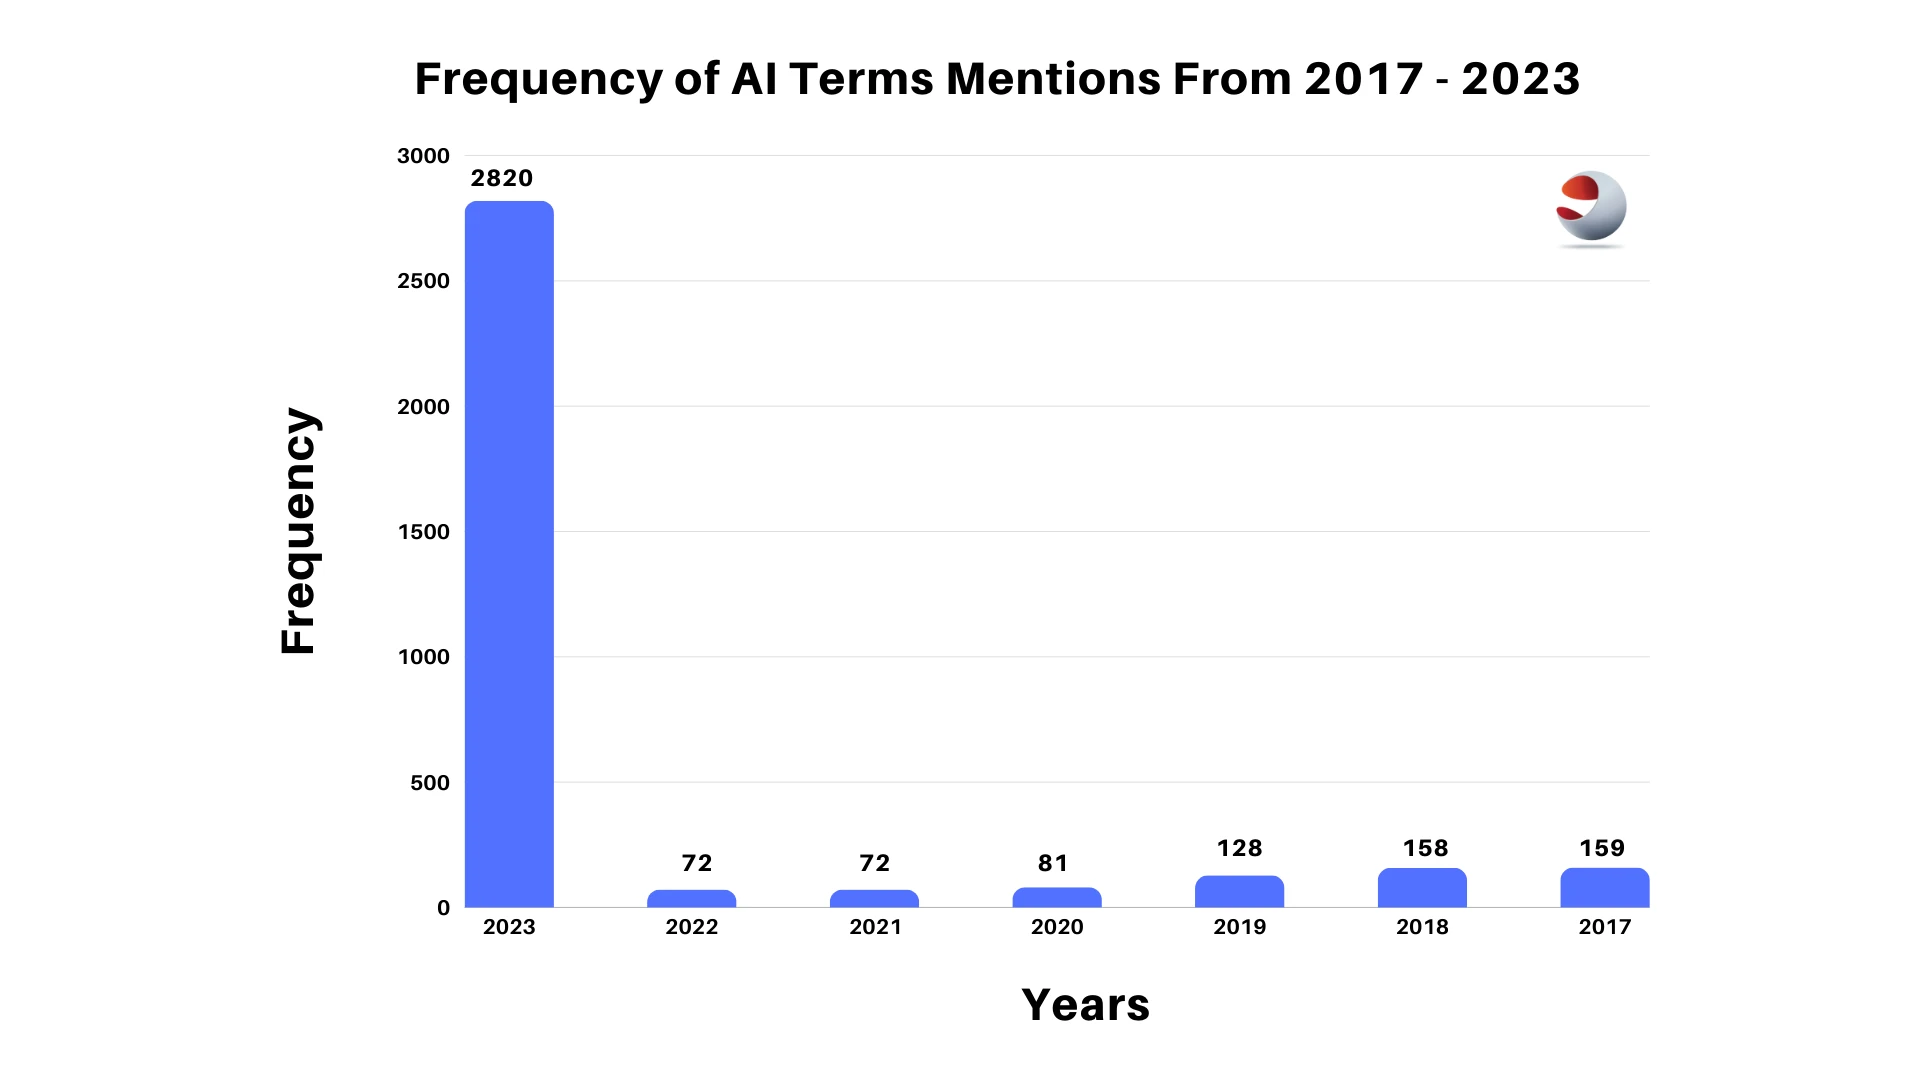
Before getting into the industries, over the last 5 to 6 years, the numbers of artificial intelligence mentions in earnings transcripts have been dwindling, having an average of 182 mentions between 2017 and 2024. But there was a dramatic shift in 2023, as we saw the number of AI mentions among companies rising to 2,820. That’s about a 2,076 difference when compared to the mentions within the previous decade from 2012 to 2022. A look at the graph below will provide a clearer perspective.
Frequency AI Terms mentions from 2017-2023
Top industries Appearances by AI terms
From an industry perspective, certain sectors have prominently featured AI in their reports. Notably, Technology, Banking and Financial Services, Business Services, Pharmaceuticals, and E-commerce have taken the lead.
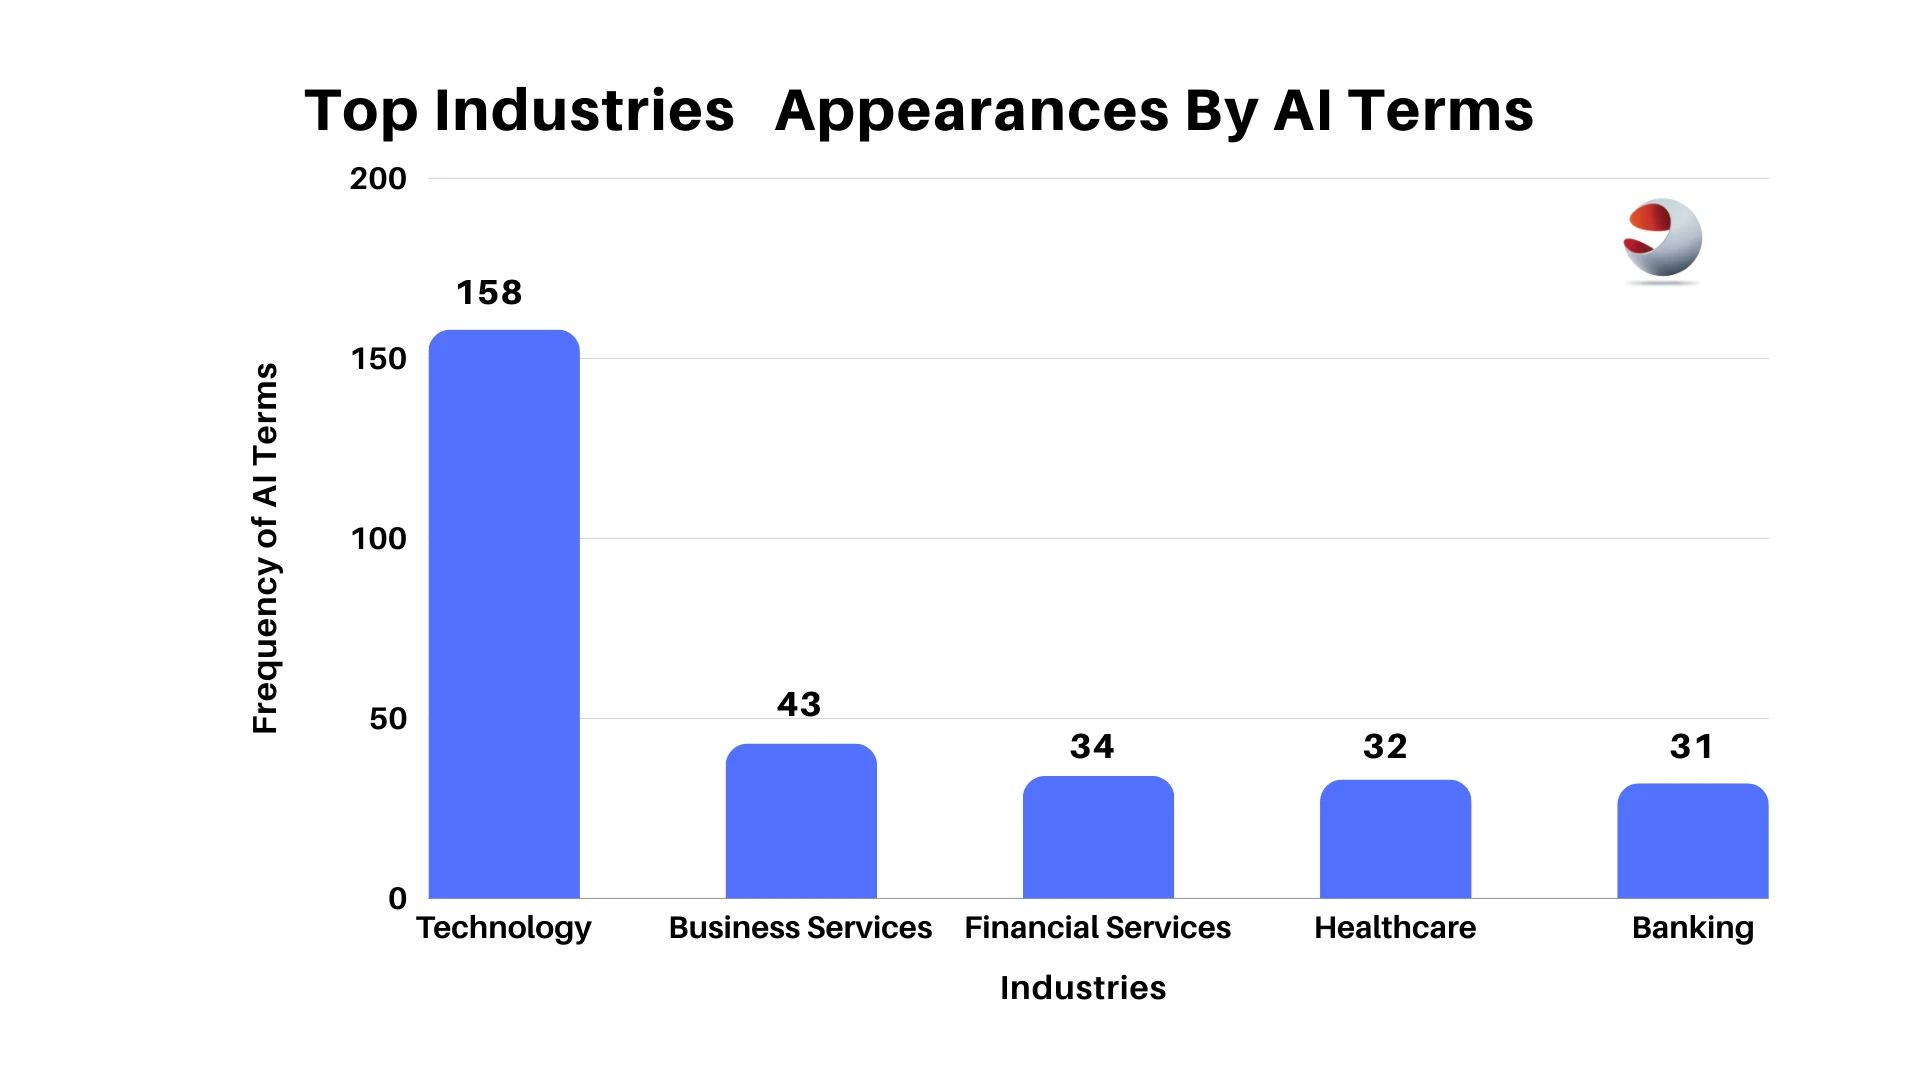
Notably, the forefront of the AI movement was led by companies in the Technology, Banking and Financial Services, and Energy sectors. Among these, Technology companies were most prevalent, making a remarkable 158 appearances, more than double that of the second-ranking industry. Following closely were Business Services and Financial Services, making 43 and 34 appearances, respectively, from 2012 to 2022.
Nvidia Corporation, an American technology company, is renowned for its high-performance Graphics Processing Units (GPUs) and related technologies. These GPUs have extensive applications in various fields, including gaming, rendering, scientific computing, and more
Top Companies With AI Mentions
The company recognized the immense potential of AI and started investing heavily in developing specialized AI hardware and software solutions. The company introduced the Nvidia Tesla GPUs, designed for AI and high-performance computing workloads. The Tesla GPUs, with their Tensor Cores and CUDA support, offered unprecedented processing power for AI applications.
Furthermore, Nvidia also unveiled the “Nvidia DGX” series, which consists of pre-configured AI supercomputers. These systems integrate multiple high-end GPUs, deep learning frameworks, and optimized software to enable enterprises and research institutions to accelerate their AI development and research.
Recent news reports have revealed that Nvidia is taking significant strides in the AI space beyond just developing technology. In a remarkable move, Nvidia is investing a substantial $50 million to accelerate the training of Recursion’s AI models for drug discovery. This investment showcases Nvidia’s commitment to supporting the development of other AI-related products and applications, further solidifying its position as a key player in the artificial intelligence industry.
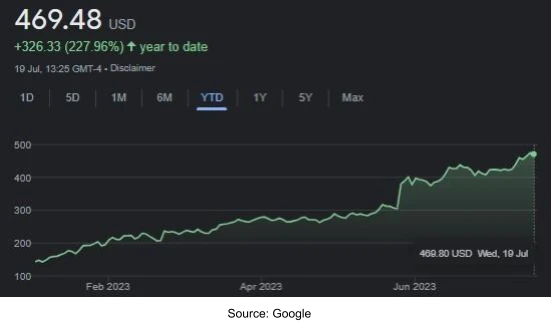
Nvidia’s Stock Chart – Jan 1, 2023 to Jul 19, 2023
As the age of artificial intelligence continues to unfold, more companies have started to allocate significant resources to develop and integrate AI services into their existing offerings, with companies that recognize and embrace the transformative power of AI technology and are likely to reap substantial rewards in the long run.
03. The Power of Robotics: Driving Productivity and Boosting Profits
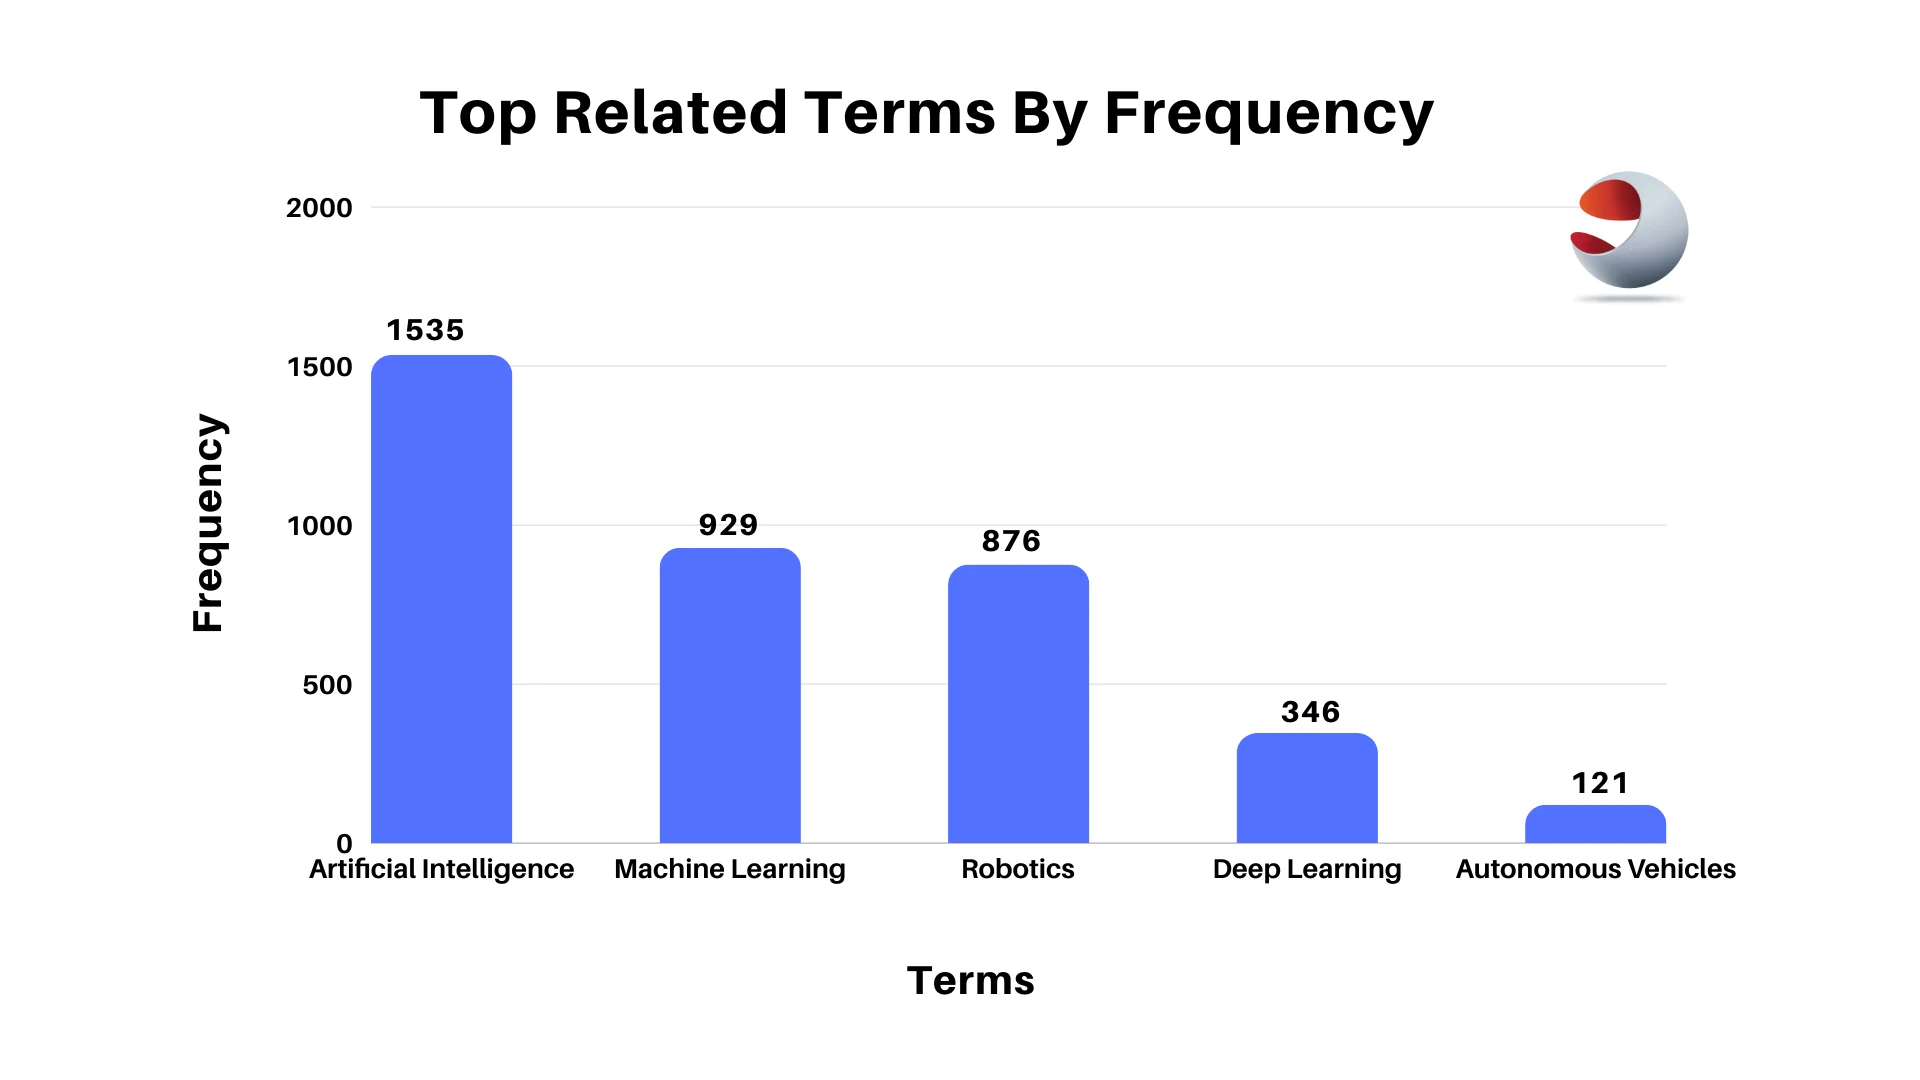
Top Related Terms By Frequency
A study by the International Federation of Robotics titled “The Impact of Robots on Productivity, Employment, and Jobs” quoted a statement by an Economist, David Autor, who said, “When automation or computerization makes some steps in a work process more reliable, cheaper or faster, this increases the value of the remaining human links in the production chain.”
The study aimed to shed light on the misconception that the introduction of robots and the rise of automation will lead to the loss of jobs and a reduction in the value of human labor, which is the reason why many individuals and government bodies tend to be somewhat opposed to the need of an automated society.
But some companies, as we see from the mentions in the earning transcripts, are seeing it from a different perspective. While true robotics and automation do eliminate roles that are often repetitive and require little to no cognitive input, they often help these companies cut costs and operate effectively while increasing the worth of human labor, as these tend to move on to roles that require them to be better active participants in the process. So, it’s a win-win for the organization and the employees.
One can find an excellent example in a study by Economist James Bessen. Bessen made a good case that “the introduction of ATMs in the 1990s did not lead to a reduction in the number of bank tellers that these machines theoretically replaced. Although individual bank branches did reduce the number of tellers per branch, they also opened more branches to remain competitive, and tellers’ jobs focused on more high-value tasks in customer interaction.”
The advent of robotics offers organizations a competitive edge while benefiting the workforce. As robots take over repetitive and mundane tasks, employees are freed up to engage in more high-value and meaningful work, which can lead to increased job satisfaction and personal growth.
Additionally, the integration of robots allows small and medium-sized businesses (SMEs) to effectively reduce costs, making them more competitive within their respective industries. Considering that SMEs represent a significant portion of businesses worldwide and play a crucial role in employment and economic growth, the adoption of robotics can have a far-reaching impact on job creation and economic development.
Reports by the World Bank highlight that SMEs contribute substantially to employment, particularly in emerging economies, where they can account for up to 40% of formal SMEs. As these businesses grow and leverage robotics for efficiency, they have the potential to scale faster, leading to the creation of more high-value jobs with the potential for higher pay.
Recognizing the transformative potential of robotics, companies are increasingly focusing on investing in this technology, disregarding the skeptics’ concerns. Instead, they are harnessing the power of robotics to foster growth, not just in business but also in society. By strategically incorporating robotics into their operations, companies can uplift their employees, drive business success, and ultimately contribute to the overall progress and development of communities and societies.
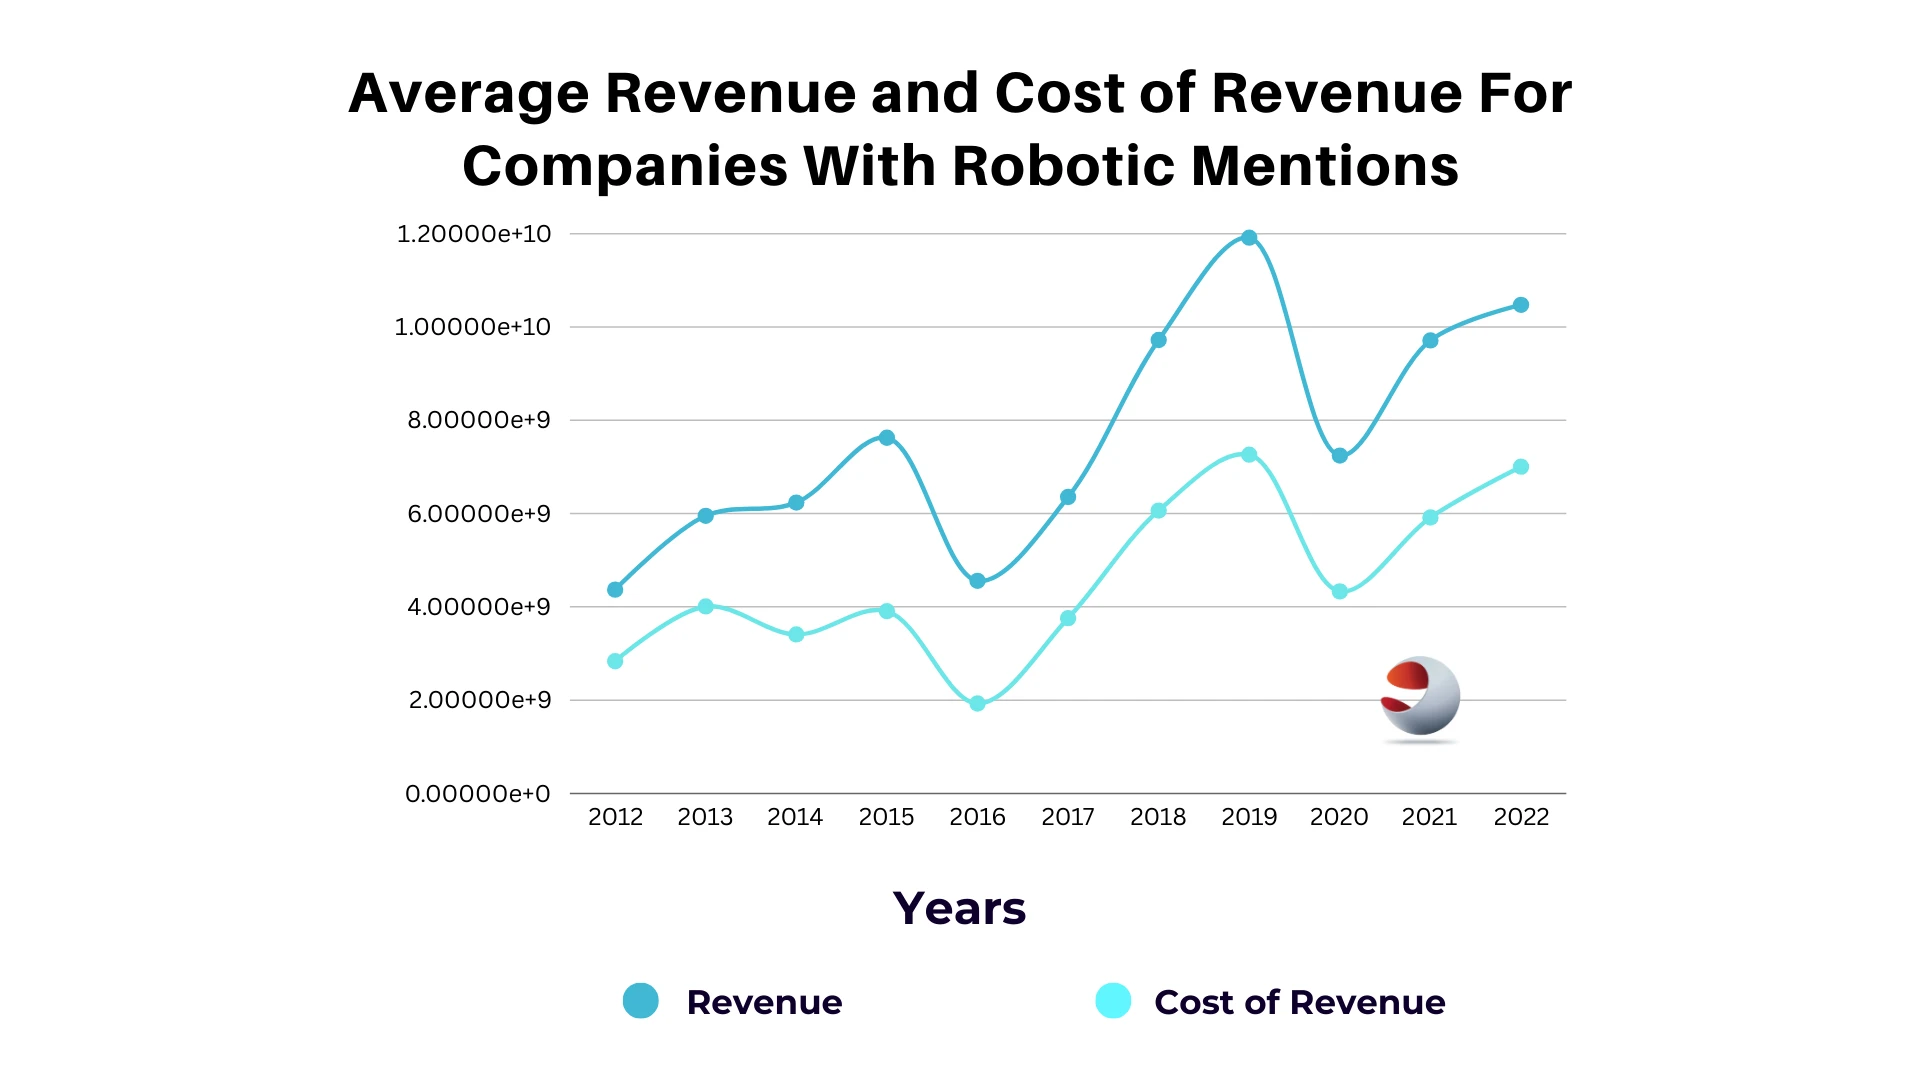
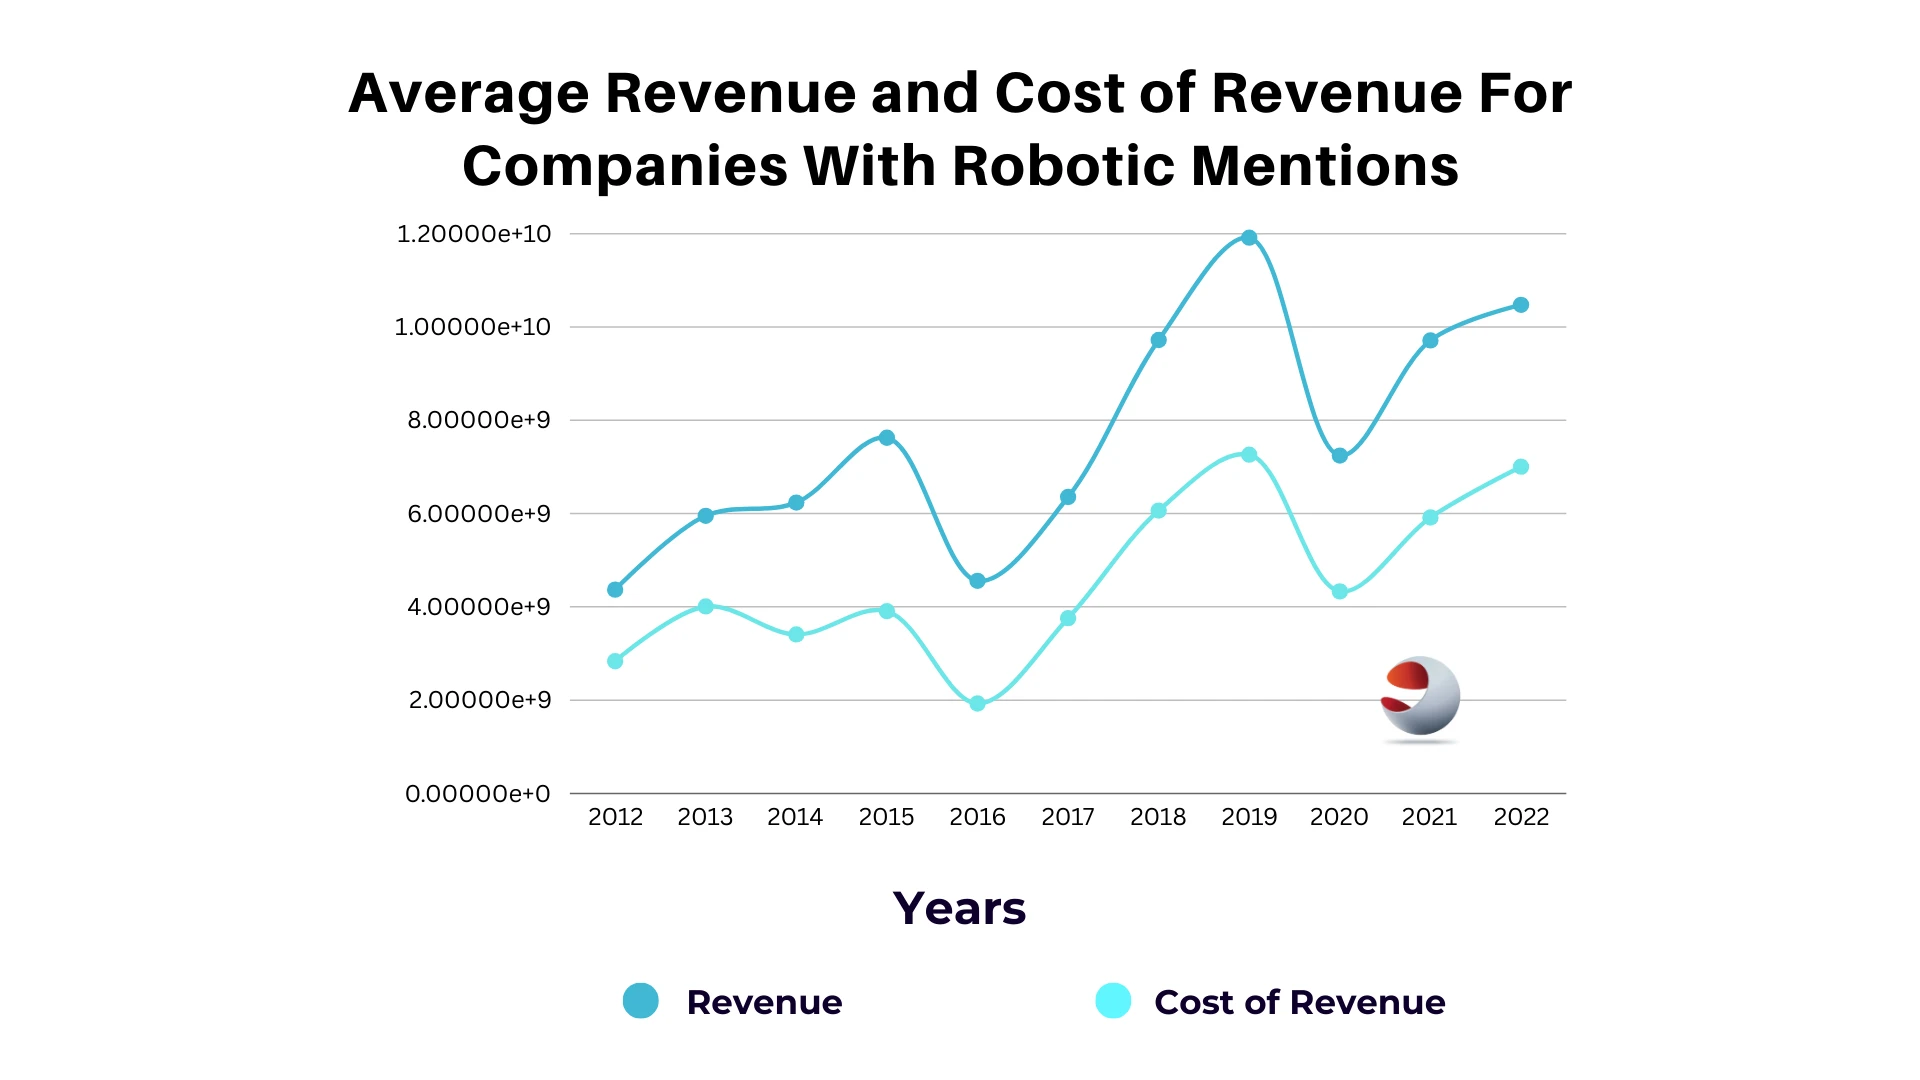
Average Revenue And Cost Of Revenue For Companies With Robotics Mentions
04. Pioneering the Way: Meta, IBM, and AMD at the Forefront of Emerging Technologies
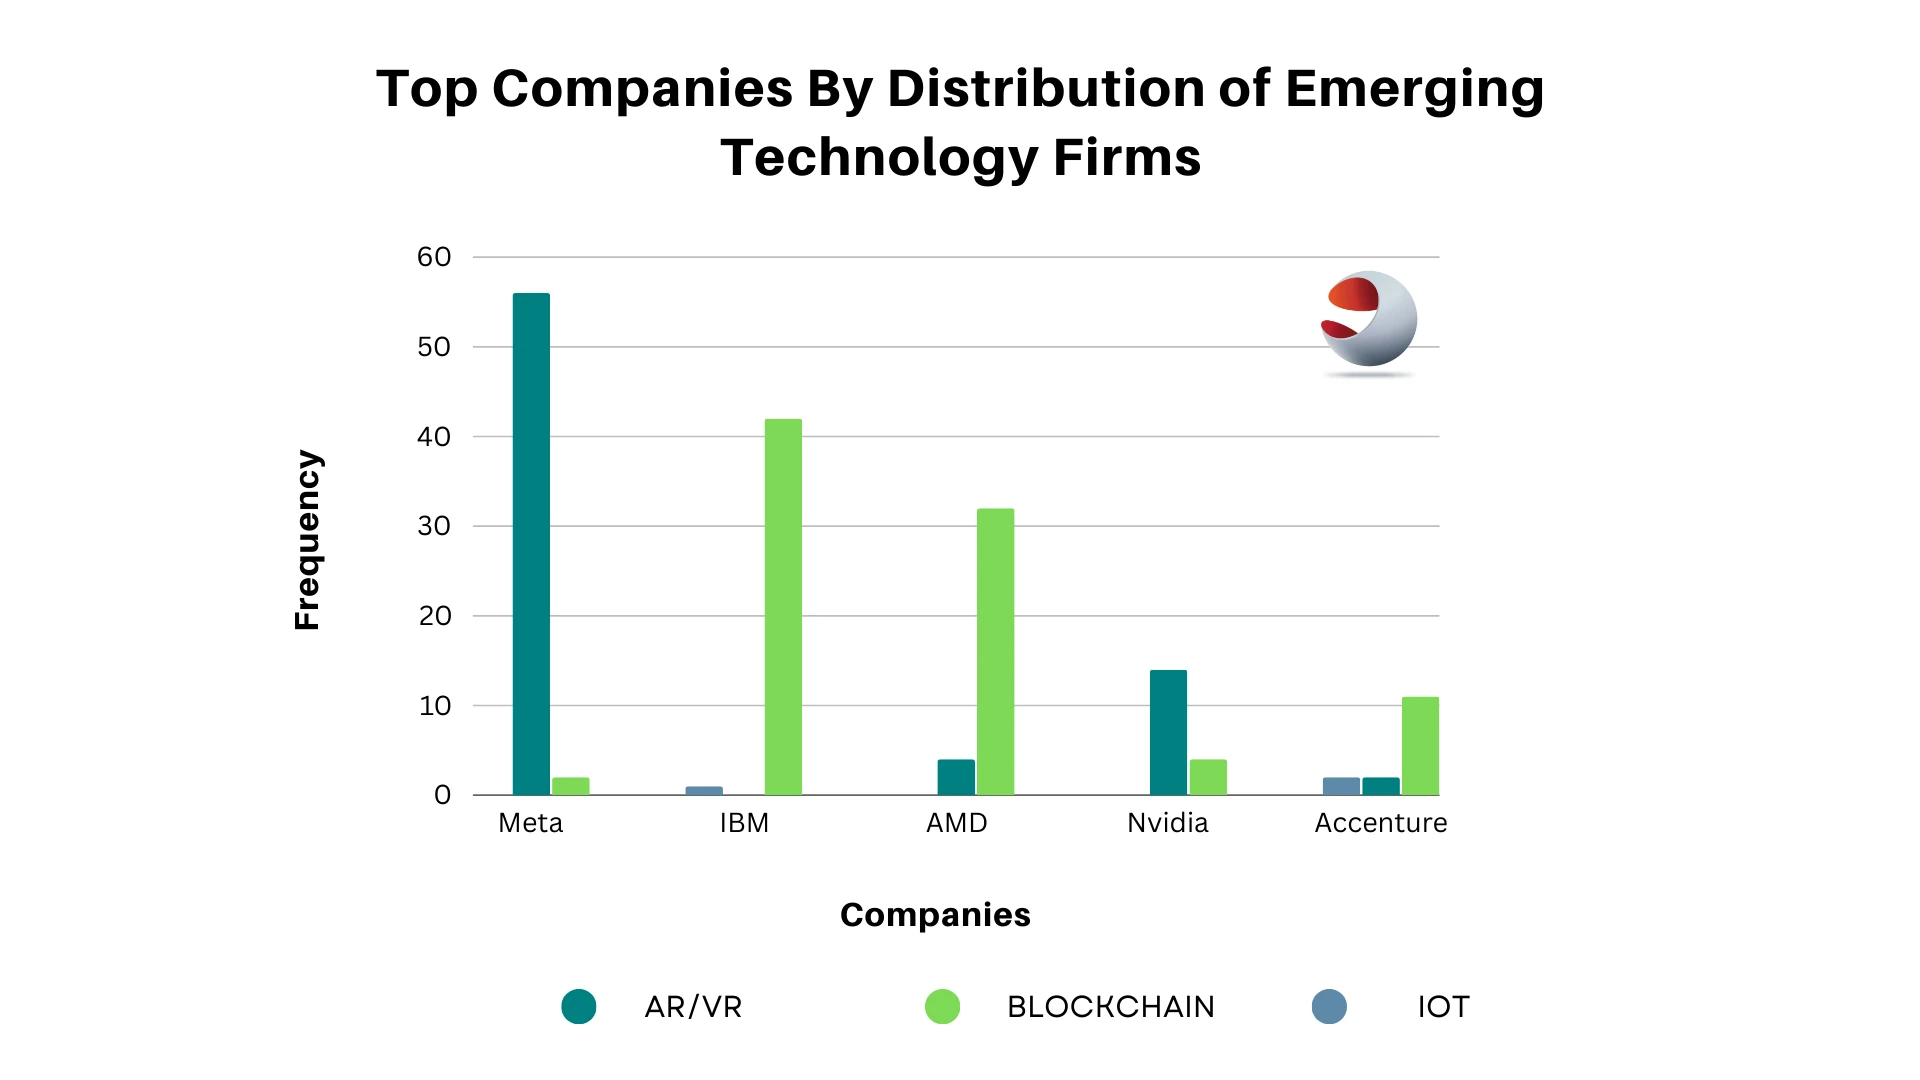
Top Companies By Distribution And Technology Firm
05. Meta’s Idea of a Virtual World

Meta’s metaverse aims to revolutionize how people socialize, work, and interact with digital content. They aim to create a welcoming and immersive platform where users can explore virtual spaces, attend events, collaborate on projects, and express themselves in ways that go beyond traditional online experiences. Meta envisions the metaverse as a dynamic and interconnected universe propelled forward by advances in virtual reality (VR), augmented reality (AR), artificial intelligence (AI), and other emerging technologies. However, only time will tell whether or not this venture will be a success.
06. IBM and AMD: Driving Forces For Blockchain Adoption
On their website regarding blockchain, they listed out a couple of benefits that they aim to provide through the blockchain such as:

Cost takeout and risk mitigation, where IBM emphasizes the potential of blockchain to reduce costs by eliminating intermediaries, automating trust verification, and enhancing data integrity. By leveraging blockchain’s decentralized and tamper-resistant nature, organizations can mitigate the risk of fraud, improve compliance, and enhance auditing capabilities.
And, new monetization opportunities, where IBM recognizes the transformative potential of blockchain in enabling innovative business models and unlocking new revenue streams. By facilitating direct peer-to-peer transactions, enabling the tokenization of assets, and supporting the creation of decentralized applications (dApps), blockchain opens up avenues for businesses to explore novel monetization strategies and tap into emerging markets.
Operational agility and speed to value, which involves streamlining and accelerating business processes through secure and transparent data sharing, enabling organizations to adapt quickly to market changes and seize new opportunities.
IBM’s drive in the blockchain sector is evident in its comprehensive suite of blockchain solutions and services, such as the IBM Blockchain Platform, which provides organizations with a secure and scalable infrastructure for developing and deploying blockchain networks. They have also been actively involved in numerous blockchain initiatives, such as the IBM Food Trust and IBM Supply Chain Management Suite, and collaborations across various industries, demonstrating their commitment to driving blockchain adoption and innovation.
AMD, on the other hand, has also shown a keen interest in blockchain technology. While their primary focus remains on developing high-performance computing solutions and advanced processors, AMD recognizes the role of blockchain in powering decentralized applications and supporting digital currencies. By providing powerful computing resources for the development of computing solutions like the SAPPHIRE INCA™ CS-14 Series, SAPPHIRE MGI-9 Series, ASRock Superb System, and MSI Blockchain Rig F12, among others, AMD aims to contribute to the blockchain ecosystem and enable efficient and secure transactions, particularly in the realm of cryptocurrencies.
Taking a look at the financials, as these technologies are still emerging, it will be most appropriate to assess them from a financial perspective once they have achieved significant technological advancements and gained a solid footing in the market. It is important to recognize that at this early stage of development, the financial performance of these companies may have little to no direct correlation with the potential success or impact of the emerging technologies they are pursuing.
Financial metrics can be influenced by a range of factors unrelated to the technology itself, such as market conditions, investment priorities, and the overall business strategies of the companies involved. Therefore, a more comprehensive evaluation of the financial implications of these technologies would be more meaningful once they have reached a more mature stage, allowing for a better understanding of their market adoption, revenue generation potential, and overall financial viability.
07. Italy and China: Emerging Data Powerhouses
The next set of terms, closely related, are the data terms, primarily consisting of Data Science, Data Analysis, and Big Data. And considering the countries spearheading this data movement, the United States, Italy, and China are ahead of the curve, although, as you can see below, the United Kingdom, Switzerland, Canada, and Germany are not too far behind.
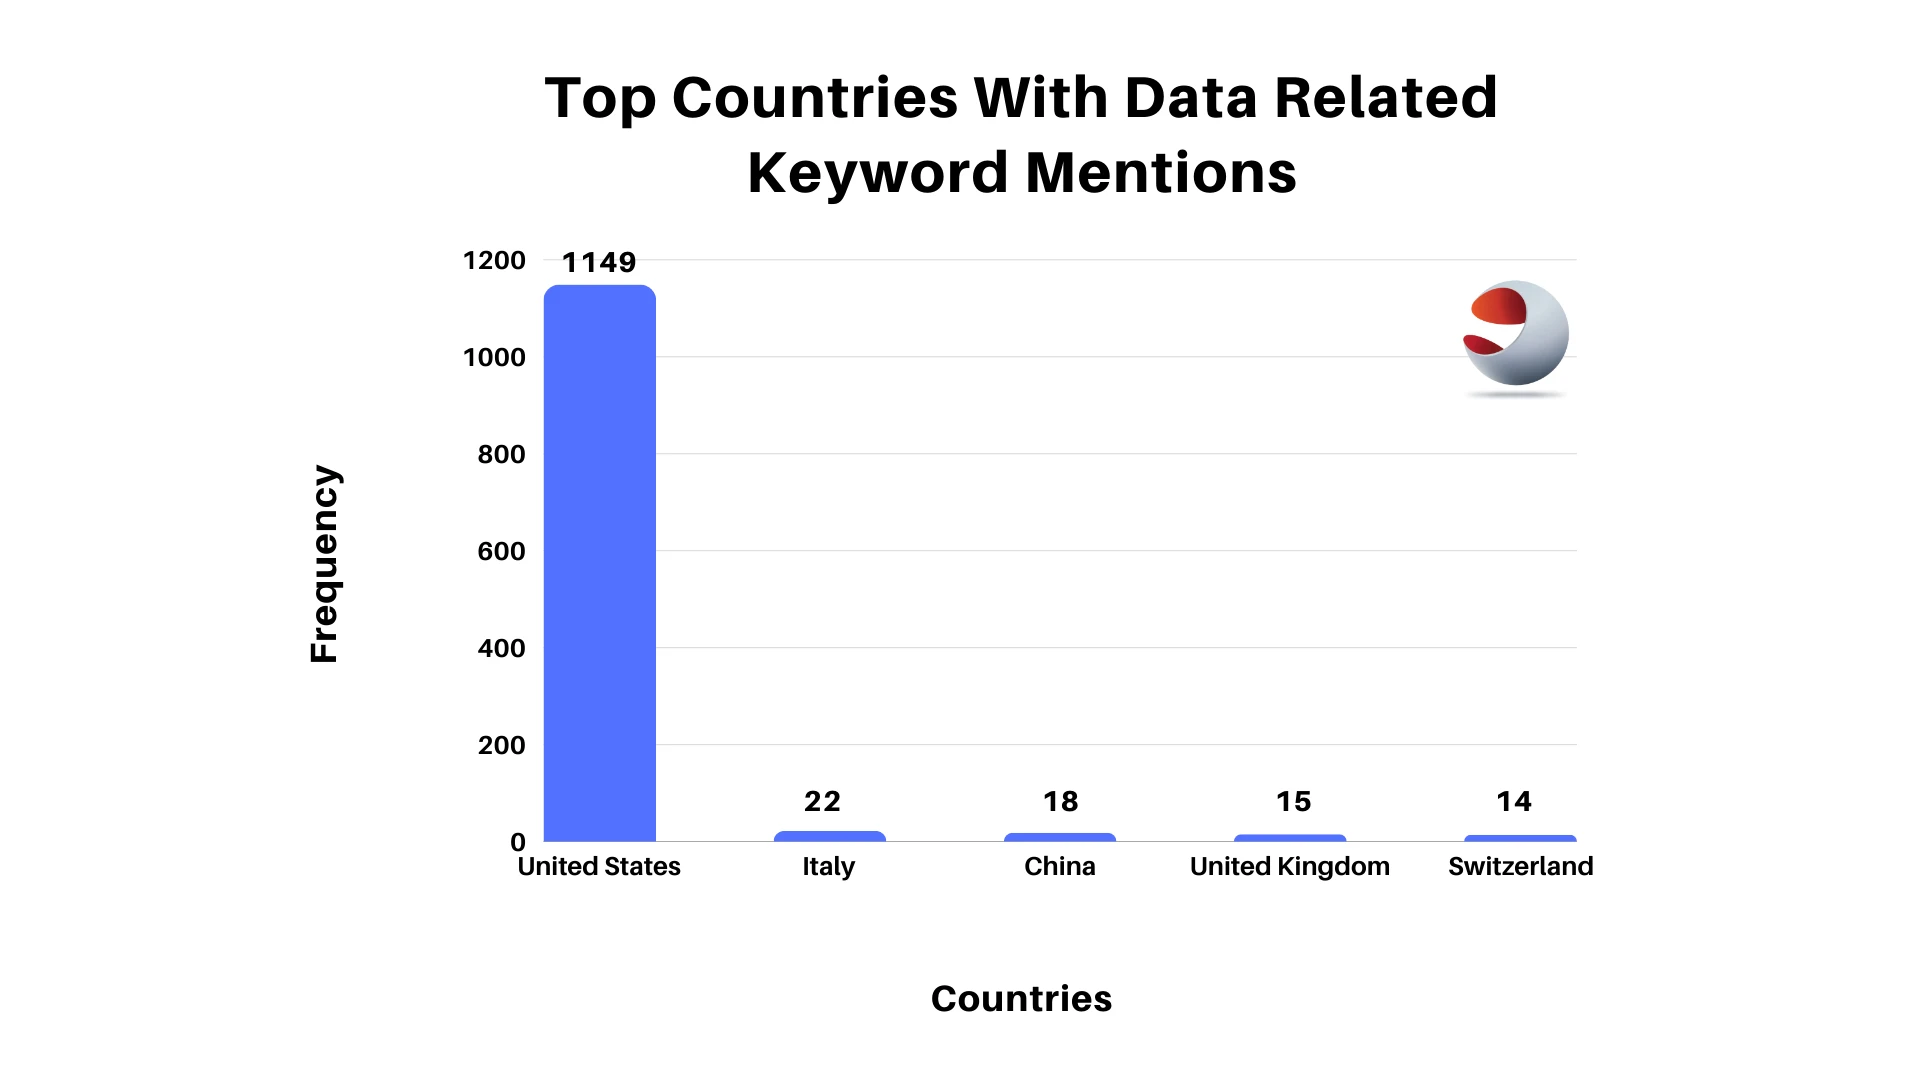
Top Countries With Data Related Keyword Mention
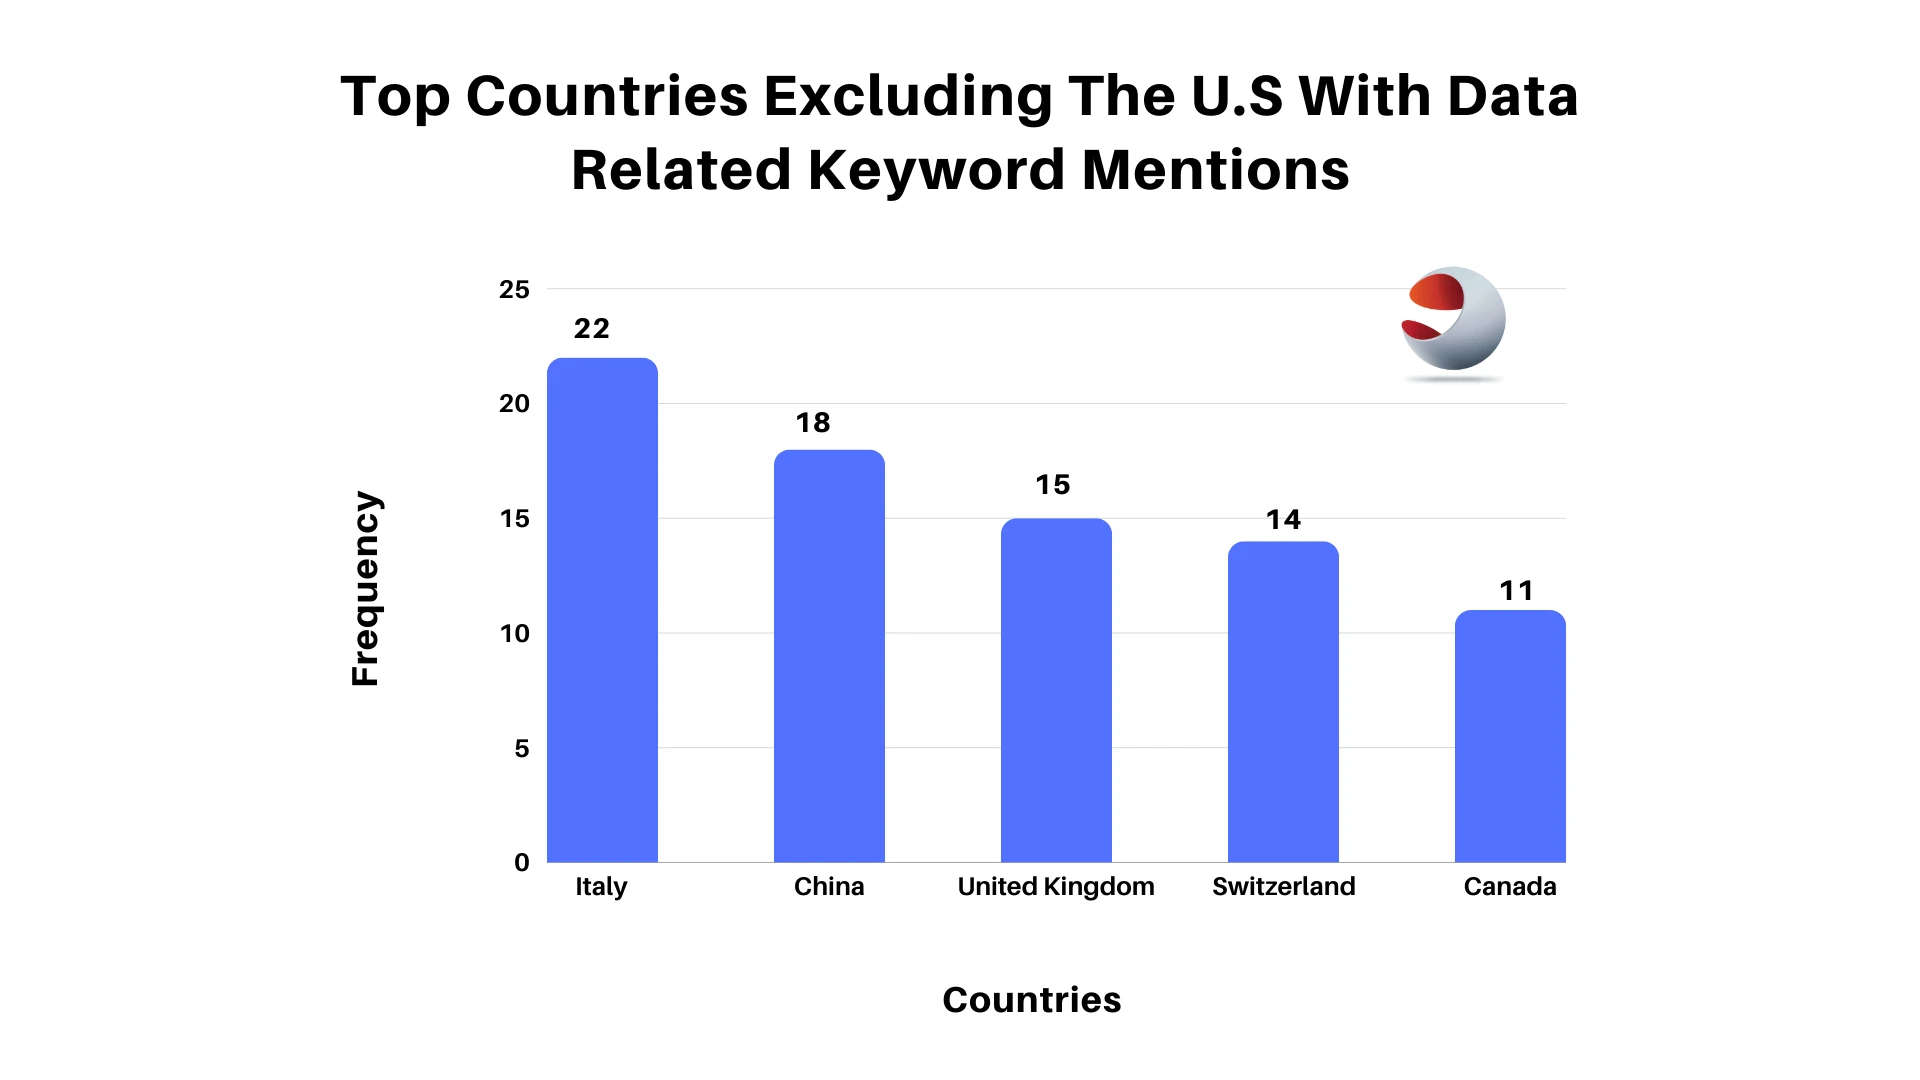
The United States is an outlier here, as most of the companies in the data are from the United States. If we leave it out, we’ll discover that the next six countries are not far apart, with Italy and China having 22 and 18 appearances, respectively.Taking out the USA due to its outlier status, let’s consider the next two countries on the list, Italy and China.
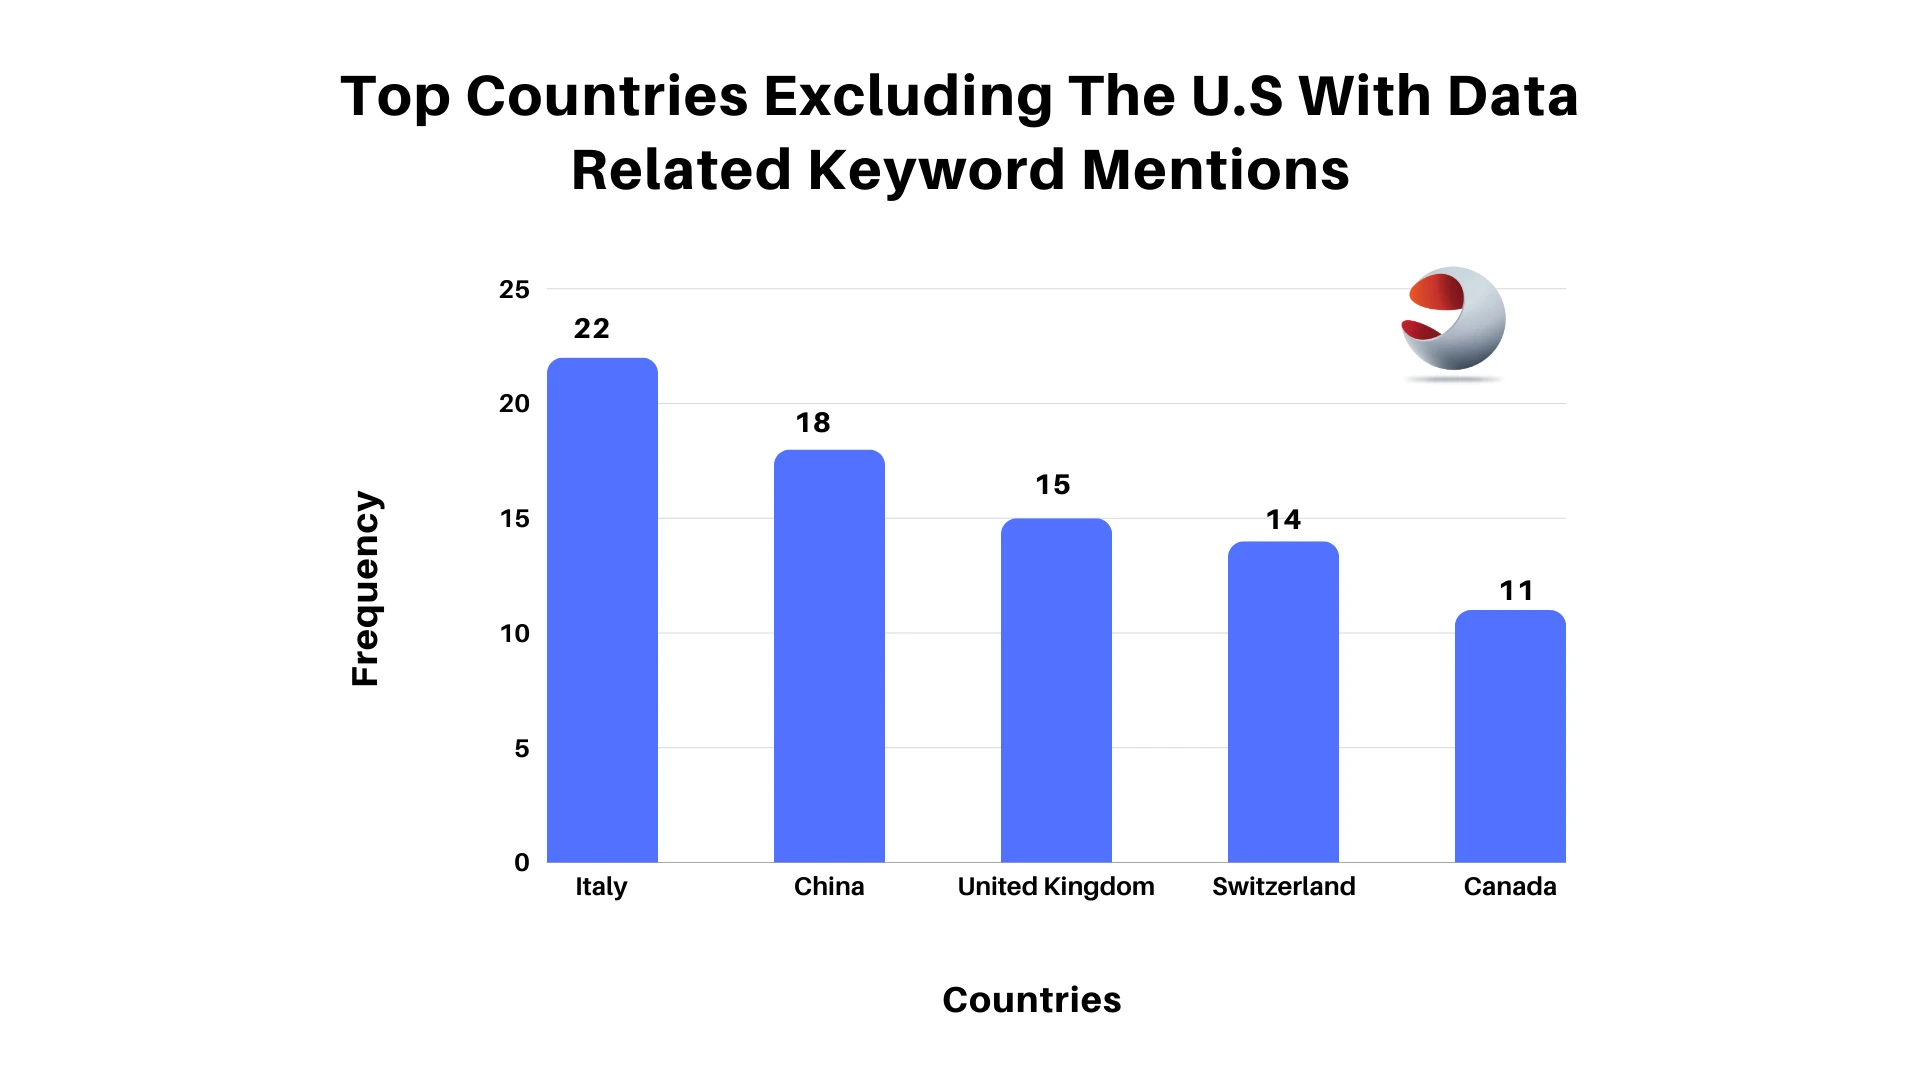
Top Countries Excluding The U.S With Data Related Keyword Mention
08. Advanced Analytics Among Italian Insurance Firms
Upon closer examination of Italy’s data-related terms, it becomes evident that these terms were predominantly mentioned in the transcripts of companies within the Insurance sector, with the breakdown being Data Analytics with 31 mentions, Big Data with 9 mentions, and Data Science with 5 mentions. An article by Mckinsey titled “Italian insurance: Achieving scale in advanced analytics”, explains this relationship between Italian insurers and data analytics, or as portrayed in the article, advanced analytics. The study was conducted by interviewing ten of Italy’s largest insurance players based on their gross written premiums (GWPs),
which serve as a key metric for measuring the size and financial performance of insurance companies. Some interesting findings from the article stated that:
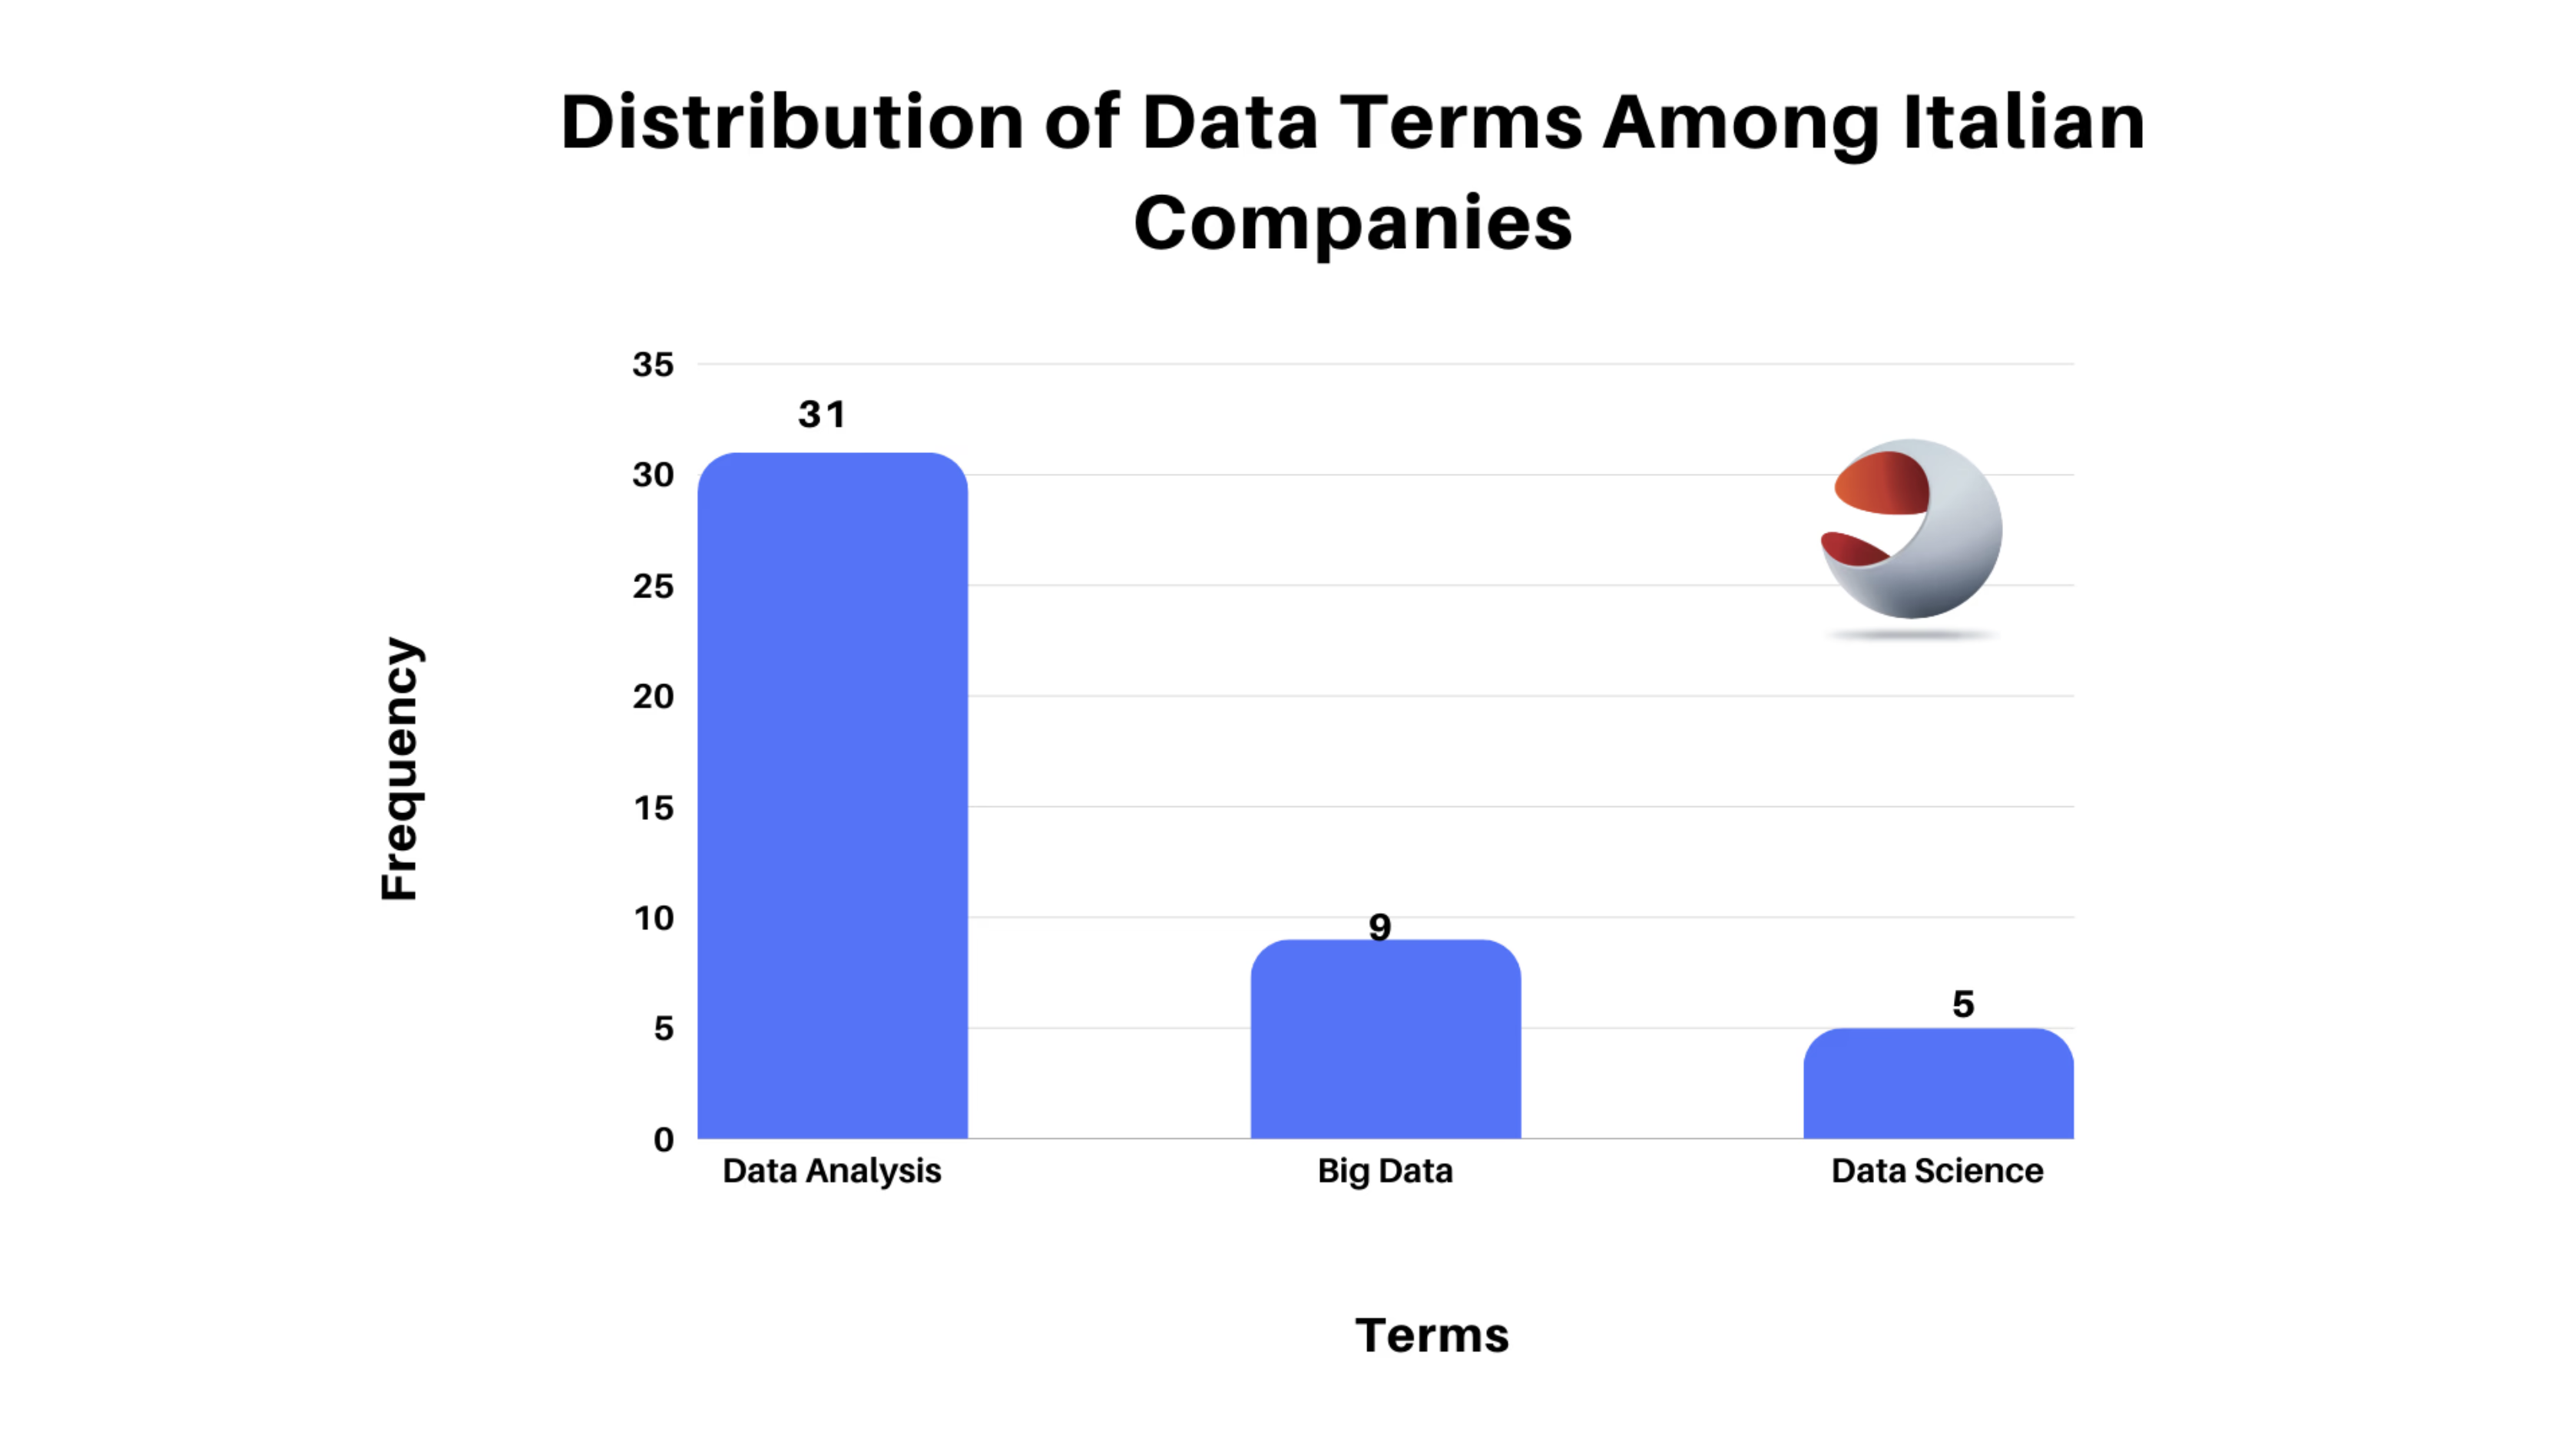
Distribution Of Data Terms Among Italian Companies
• Seven out of ten have a pipeline of advanced analytics use cases (with several already deployed at scale).
• One uses advanced analytics for most decisions, while another considers itself to be an analytics-driven organization.
On the investment side of things:
• Four out of ten spent more than €1 million on advanced analytics in 2019
• Six mentioned that they expect to spend more than €1 million in each year of the 2020–22 budget cycles (with four expecting to spend between €3 million and €8 million per year).
This study reveals a growing maturity in the industry’s adoption of advanced analytics. The fact that the majority of executives say they have reached the point of capturing value at scale indicates that analytics has been successfully integrated into their business processes. This indicates that they have overcome initial implementation challenges and are now reaping the benefits of their analytics investments.
This explains why data analysis is frequently mentioned in the earnings transcripts of insurance companies in Italy. Emphasizing it simply means that they believe it is a critical factor in business success.
09. China, and Its Pursuit For Data, And By Data, We Mean Big Data.
China ranks third on the list with 18 appearances. While Italy concentrated on analytics, China focused on Big Data. According to our analysis, the Chinese companies mentioned Big Data 22 times, Data Analysis 4 times, and Data Science 0 times.
A research project titled “Chinese Views on Big Data Analytics,” sponsored by the US government and conducted within the Cyber and Intelligence Policy Center of the RAND National Security Research Division, which aims to explore China’s position on Big Data gives a good reason as to why corporations in China, among all data terms, choose to focus on Big Data.
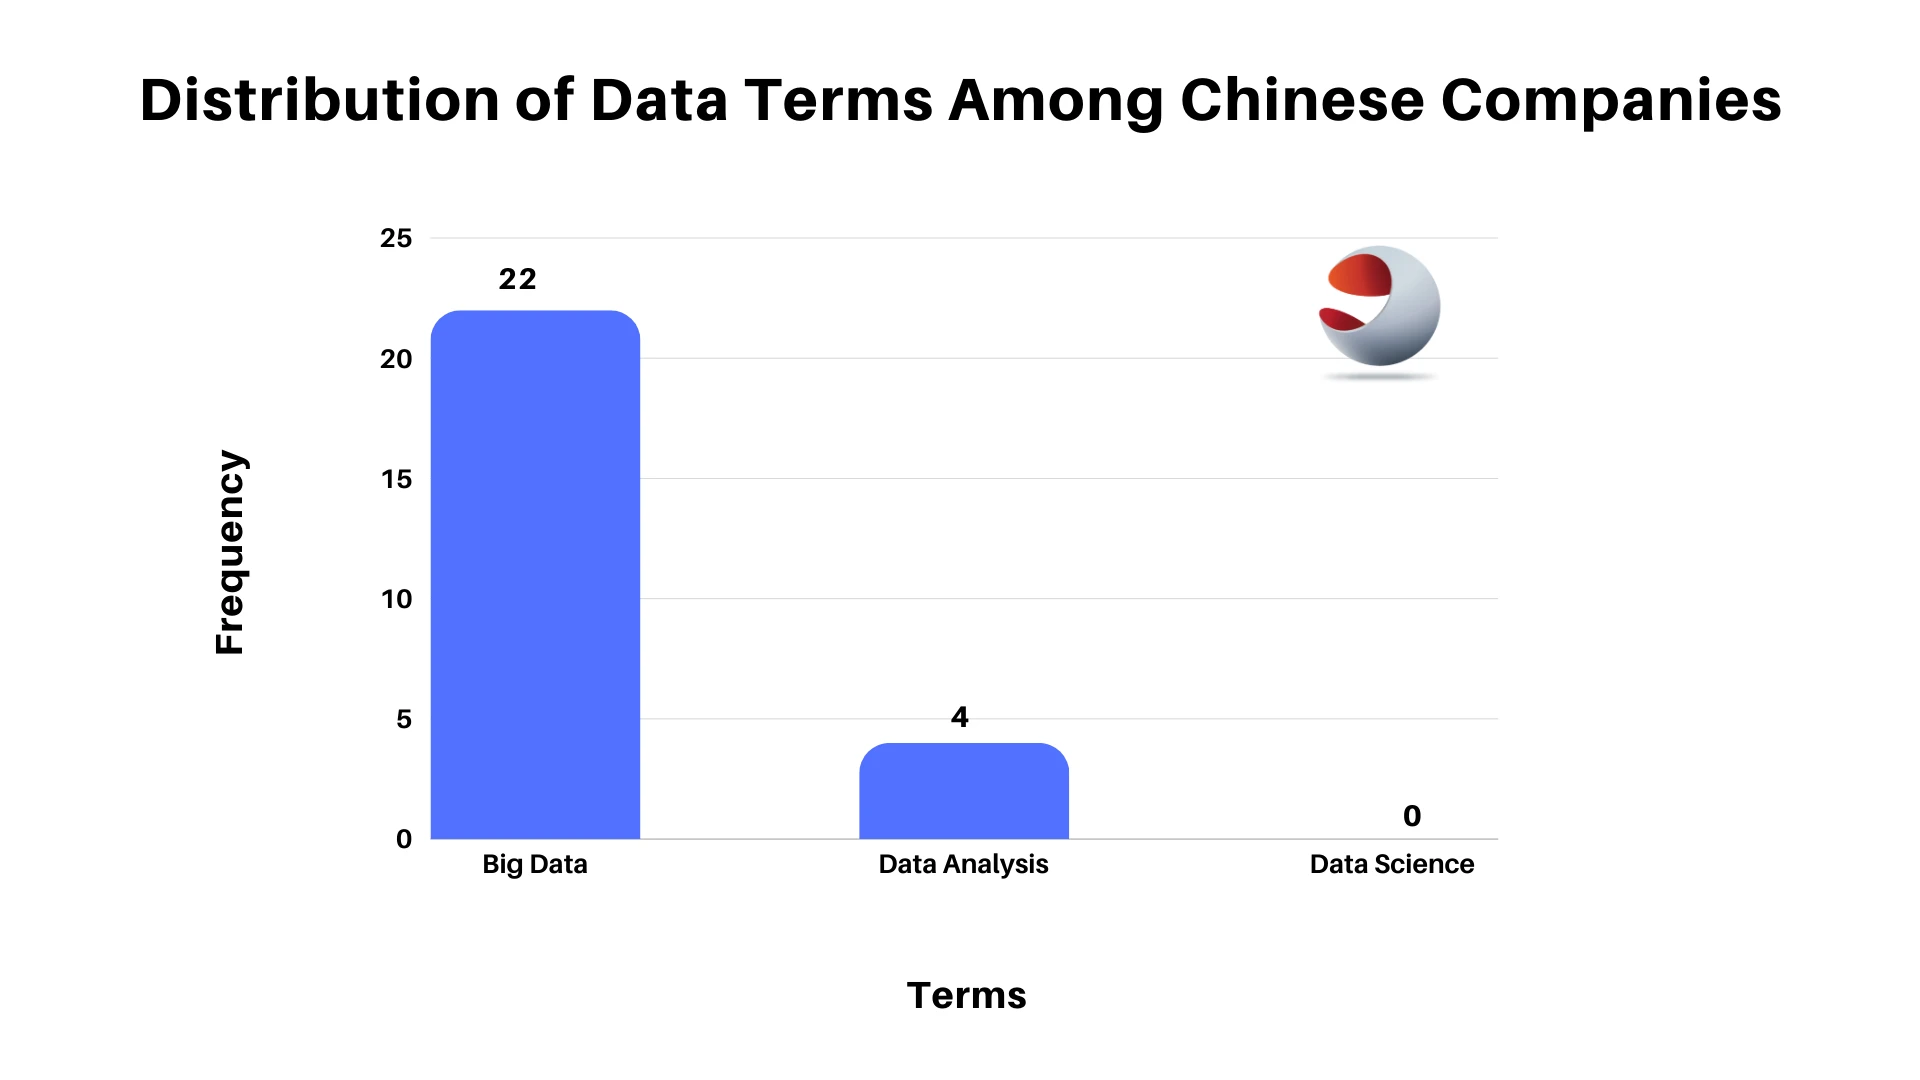
Distribution Of Data Terms Among Italian Companies
As mentioned in the research report, during the 19th National Congress of the Chinese Communist Party in October 2017, Chinese President Xi Jinping emphasized the need to “promote the deepened integration of Internet, big data, and artificial intelligence with the real economy.” In a country where the leaders have prioritized the advancement of particular technologies, it is only reasonable for companies and state-run enterprises to prioritize the development of such technologies.
Before the national congress in 2017, China’s State Council issued its “Action Plan for Promoting the Development of Big Data” in 2015. The plan stated as described in the report, that China has an advantage in big data and should use it to create new platforms for data-sharing with the public and to enhance the government’s ability to deliver services to the people.
The Ministry of Industry and Information Technology (MIIT) 2016 also published its plan for big data, titled “Ministry of Industry and Information Technology Big Data Industry Development Plan (2016–2020).” Its focus will be on centralizing Chinese datasets, creating a national data center for societal management, improving people, and raising people’s livelihoods.
All these show the Chinese government’s intentionality regarding big data, and this has its effect trickled down into what their respective corporations prioritize as they build out their technology strategy.
From the financial perspective when you consider the revenue and cost of revenue for the companies with these terms in their earning transcripts, you will discover a consistently wide margin between these two financial metrics and also a consistent increase in both the revenue and cost of revenue, signaling that companies were investing more to get higher returns on investment.
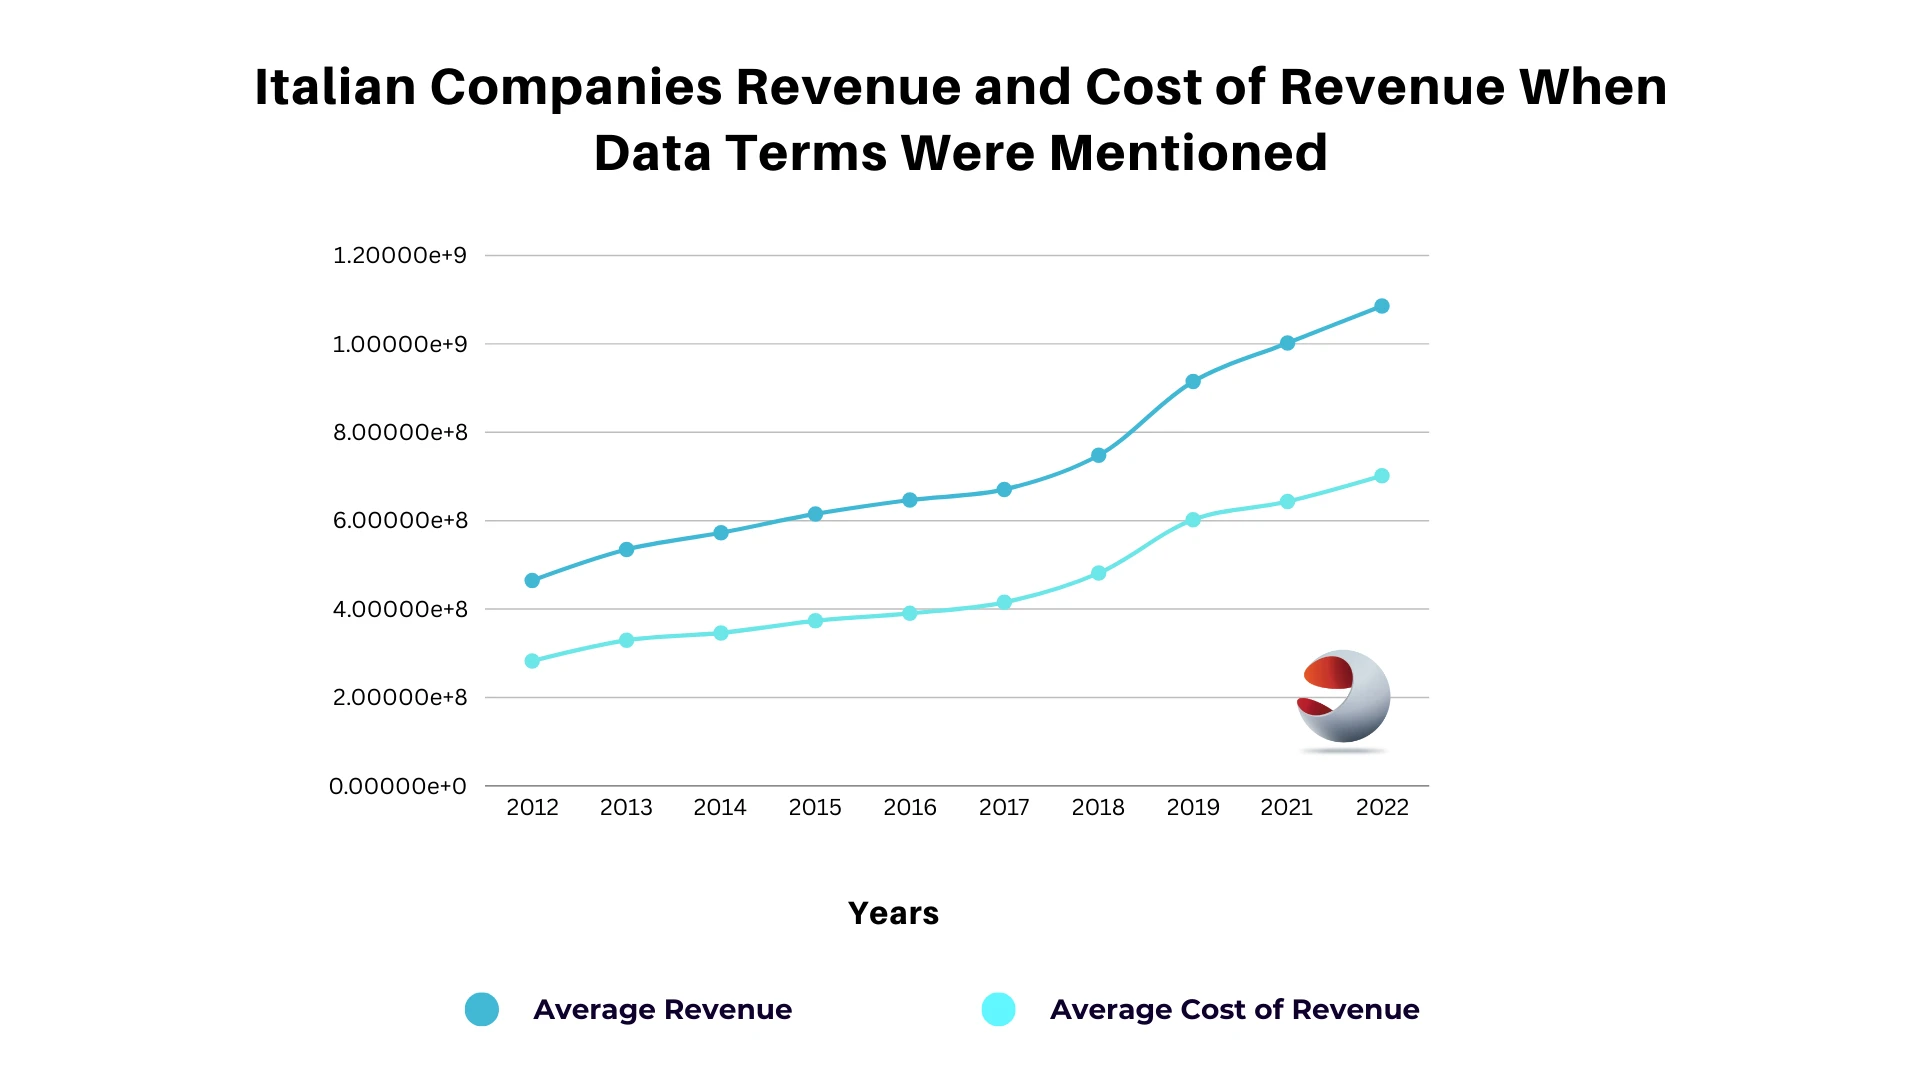
Italian Companies Revenue and Cost of Revenue When Data Terms Were Mentioned
Chinese Companies Revenue and Cost of Revenue When Data Terms Were Mentioned
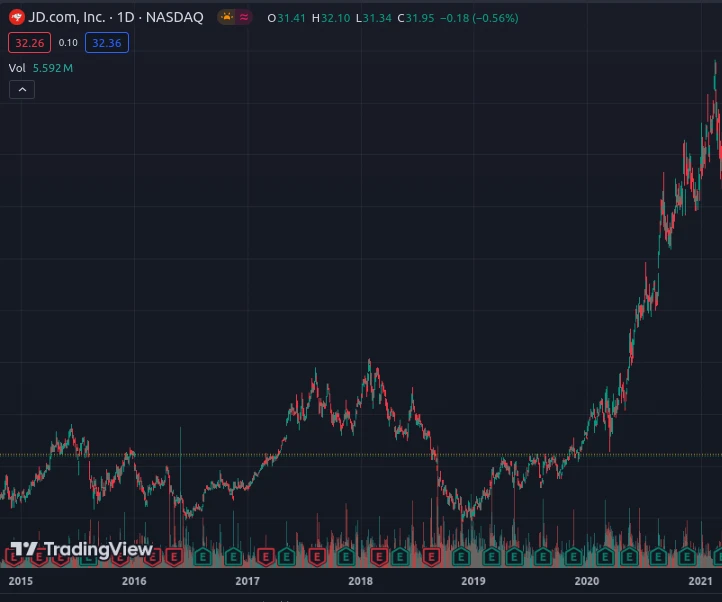
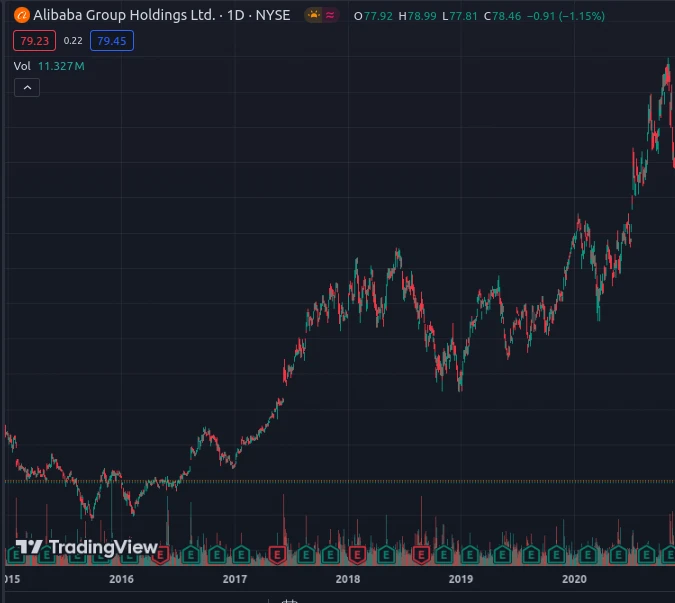
The only deviation came from China in 2016 when it was reportedly experiencing its slowest growth in 26 years, as evidenced by the stock price movements of the top companies represented in this data, JD.com and Alibaba. The stock movement is discussed further below. As can be seen, the stock price fell in 2016, reflecting the nature of the economy, and again in 2020, reflecting the effects of the pandemic, before rising in subsequent years.
10. The United States of America: A Deep Dive Into The Happenings of The World Economic Power.
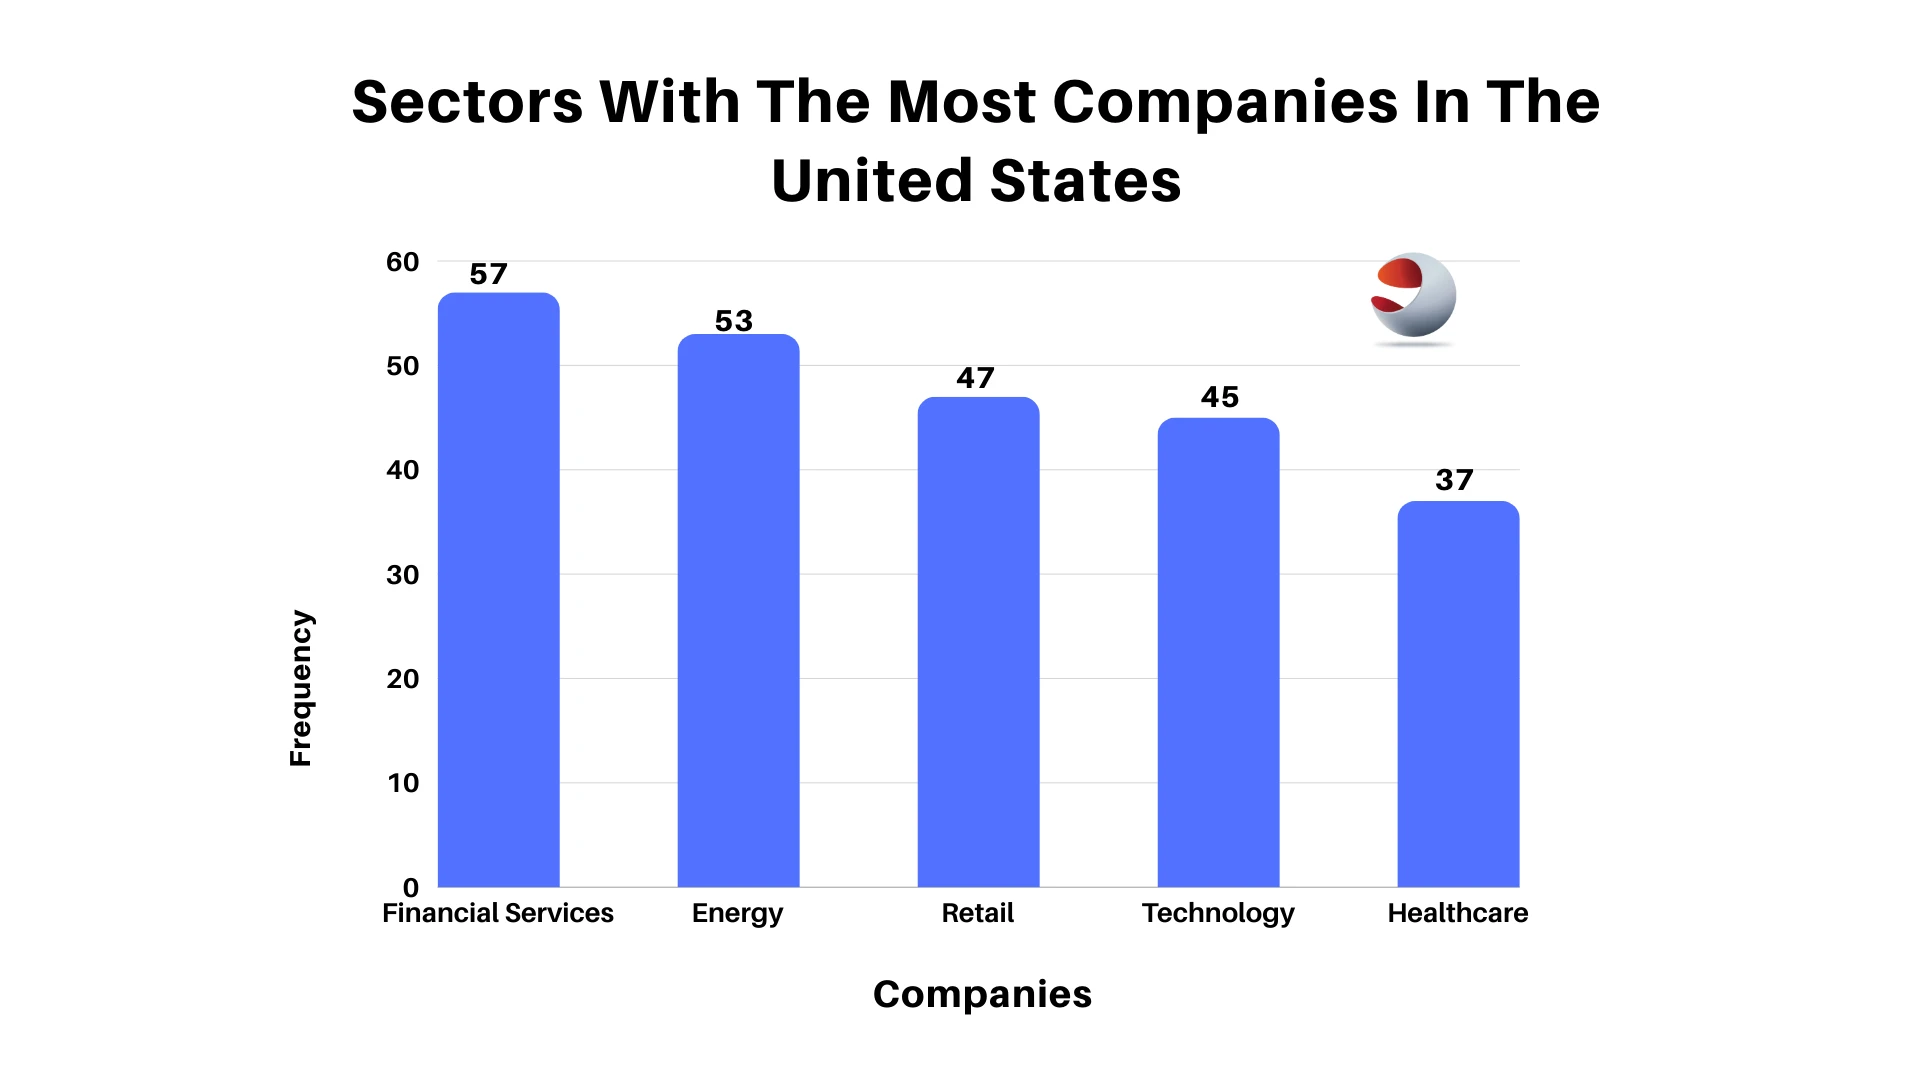
A large portion of the data came from companies in the United States. Of the 535 companies in the data, 464 were from the United States. A look at the United States from a sector perspective reveals that these companies were present in 41 of the 50 total sectors represented in the list, with Financial Services, Energy, and Retail leading the way with 57, 53, and 47 companies, respectively. The chart below depicts the top ten industries by number of companies.
Sectors With The Most Companies In The 60 United States
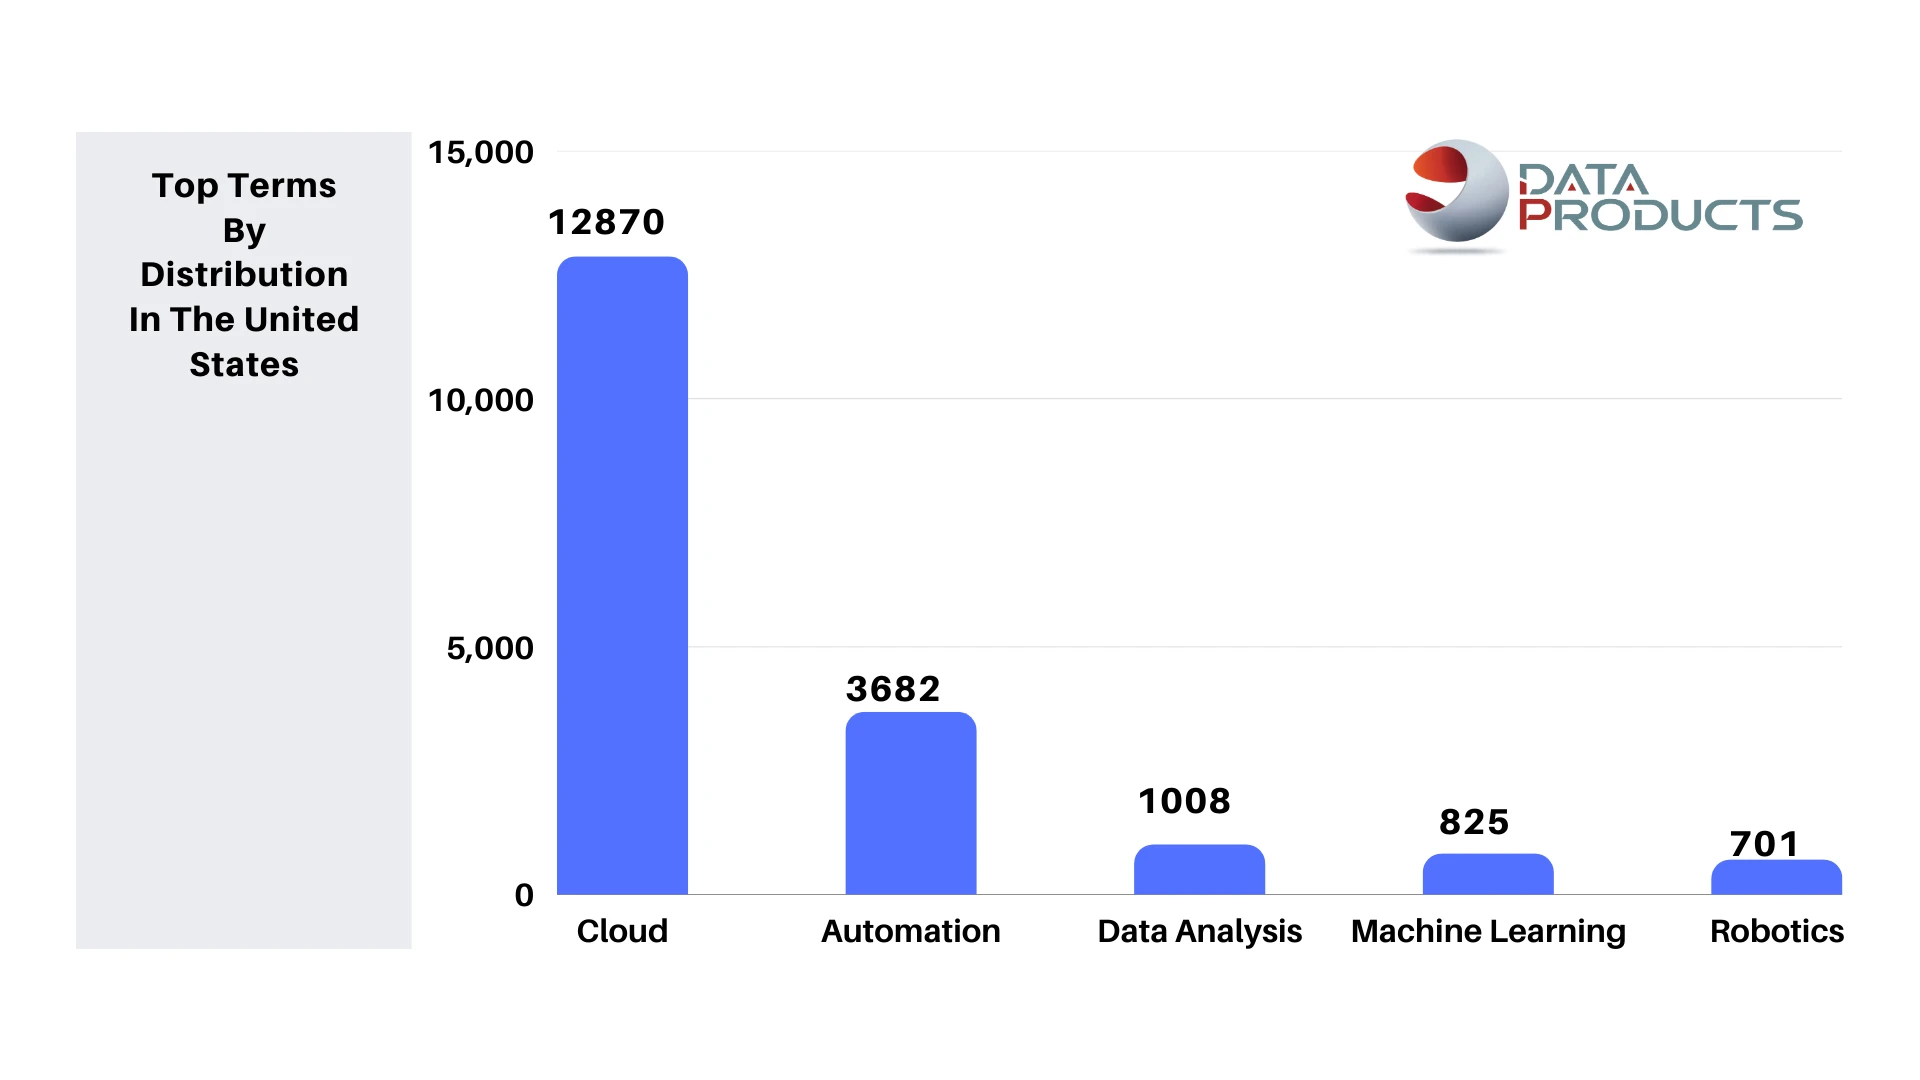
Top Terms By Distribution In The United States
A good look into its history will explain why cloud as a term was popular within the last decade or two. Before the rise of cloud computing, companies found it difficult, costly, and cumbersome to set up and manage servers while also delivering the contents of these services to different locations around the globe. With the challenges posed by running services on-premise, the launch of AWS in 2006, Microsoft Azure in 2010, Google Cloud Platform in 2011, and IBM Cloud in 2013, companies found themselves migrating to the cloud as it eliminated the upfront costs associated with setting up physical infrastructure and allowed them to pay for what they used on the go, nothing more.
Research by Wang Jin, a research fellow at the MIT Initiative on the Digital Economy, titled “Cloud Adoption and Firm Performance: Evidence from Labor Demand”, whose aim was to “show that cloud adoption is associated with significant productivity gains for a large sample of US public firms in the last decade”. The author of the paper gave two major reasons as to how the cloud has impacted firms’ productivity, the first being firms using it to substitute more expensive inputs such as IT costs and IT-related labor and produce the same amount of output with lower costs, the second being firms using it to support and improve their production for output growth.
These productivity gains were only possible because of the advantages of cloud computing over traditional on-premise IT, which the author mentioned, such as the fact that it allows firms to scale operations up and down without significant IT constraints and delays, as well as the pay-as-you-go business model, which allowed these firms to be cost-effective in their cloud dealings, and the third, and probably most important, was the provision of high mobility.
Not left out of the cloud adoption process is the government of the United States, as the planning for cloud adoption by Federal agencies began with a publication in 2010 by the Federal Chief Information Officer (CIO), as stated in research by the Congressional Research Service. The reason for this adoption was that the “Federal CIO recognized that too many past federal IT projects had run over budget, fallen behind schedule, or failed to deliver promised functionality. The plan stated that the federal government would shift to a “Cloud First” strategy, which it stated would be more economical, faster, and more flexible.”
A report released by the U.S Government Accountability Office (GAO) accessing the use of cloud services by federal agencies discovered that:
• 10 out of the 16 have reportedly increased their use of cloud services between fiscal year 2016 through 2019.
• 16 agencies have reportedly increased their cloud service spending since 2015
• 13 out of the 16 agencies have saved $291 million to date from these services.
These numerous advantages and the results proposed by both research studies are pointers to why some public US companies and also the US government decided to adopt the cloud early rather than wait for it to reach a maturity point, and this decision seems to have paid off as it has boosted productivity and resulted in cost-effective and efficient ways to run operations in the cloud
11. Automation: A Catalyst for Manufacturing Growth
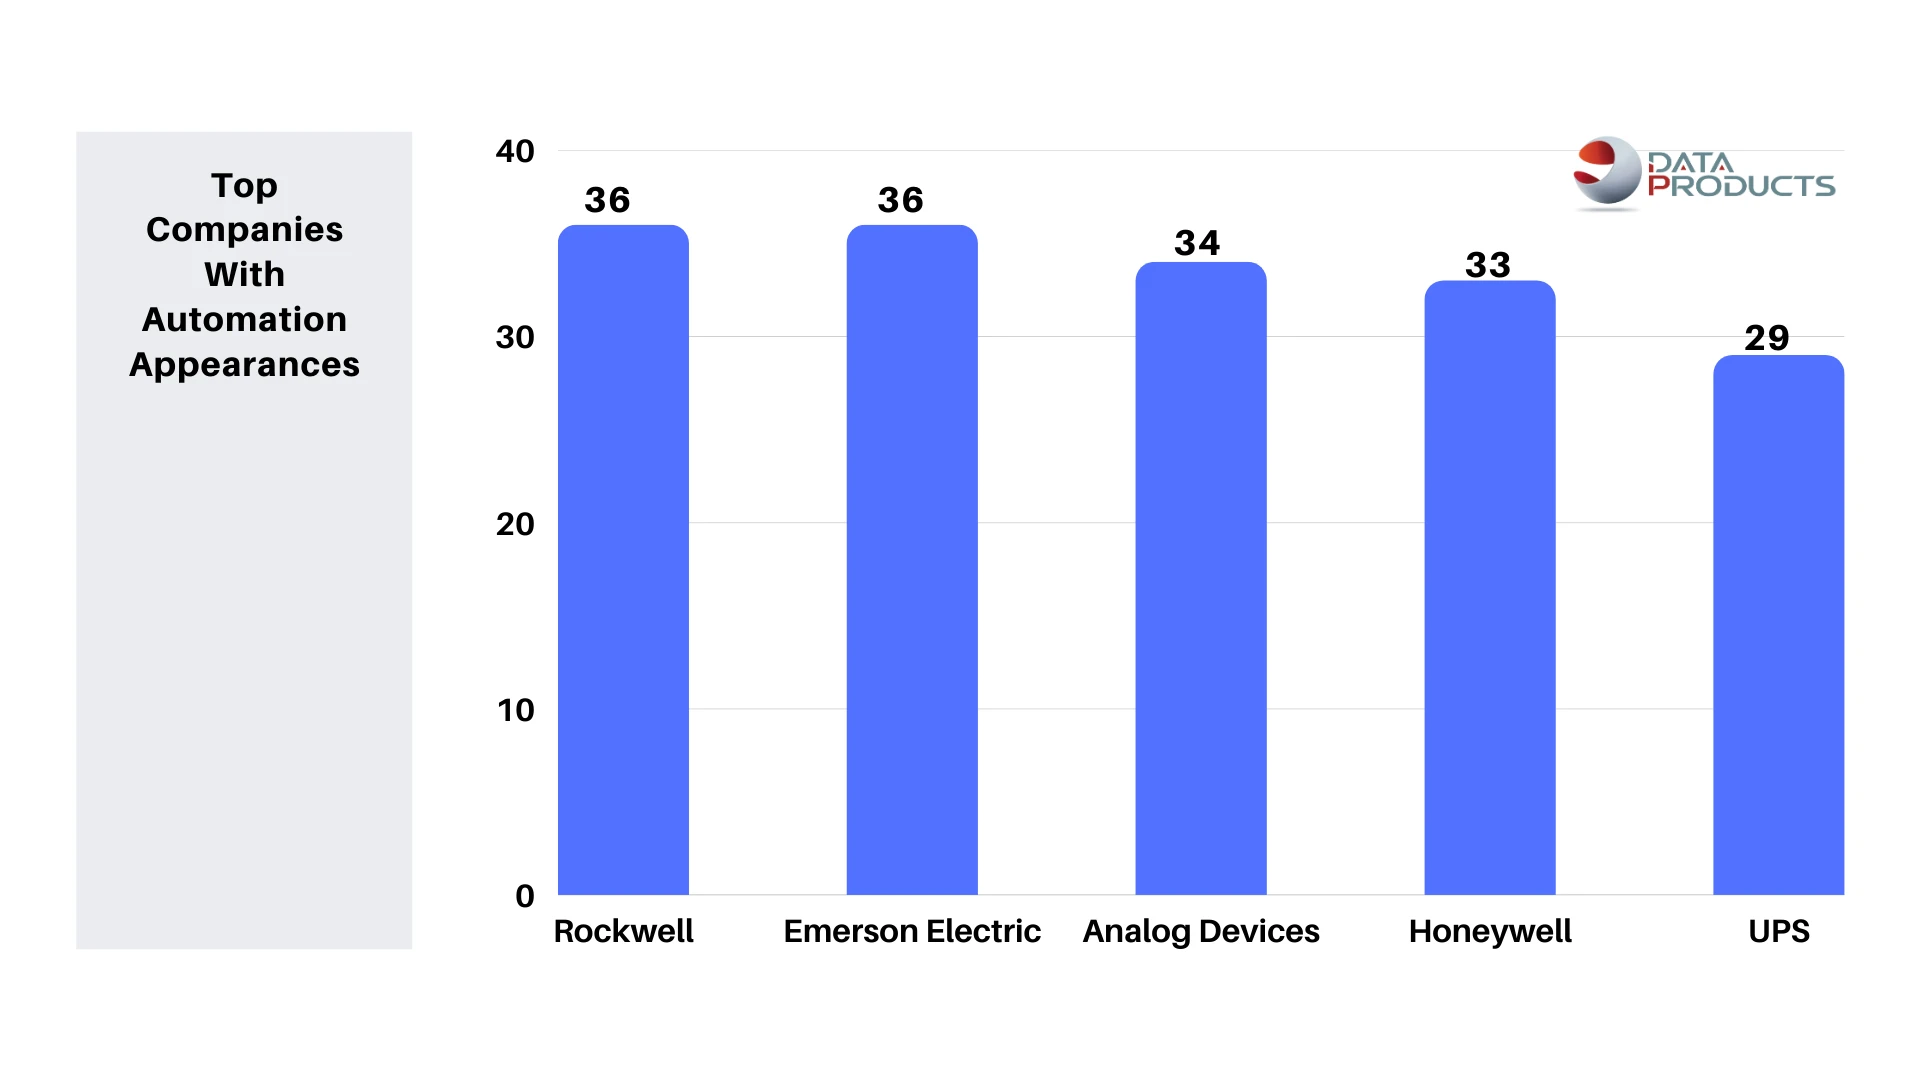
The next term on the frequency ladder is Automation. And a closer look through companies using this term most frequently is found in the manufacturing sector, with Rockwell Automation, Emerson Electric, Analog Devices, and Honeywell International leading the way with 36, 36, 34, and 33 appearances, respectively. We might want to exclude Rockwell Automation as having the term in its name will increase the count, as it might be called frequently without being related to the actual automation terms. So that leaves us with Emerson Electric, Analog Devices, and Honeywell International as the top firms with automation in terms of frequency, and they are all manufacturers of products.
Top Companies With Automation Appreance
Revenue and Cost of Revenue of Companies With Automation Terms
These manufacturing powerhouses have recognized the compelling need to incorporate automated technologies into their production processes as top firms frequently associated with automation. Automation has emerged as a critical driver of success in an ever-changing industrial landscape, where the market demands and consumer expectations continue to evolve rapidly. These businesses recognize that staying ahead in the competitive manufacturing sector necessitates more than traditional approaches. They can not only streamline operations but also strengthen their capabilities to meet future challenges by leveraging the transformative potential of automation.
One of the most important reasons these leading manufacturers value automation is its ability to boost productivity and efficiency to previously unheard-of levels. Automation enables them to optimize production workflows, reduce downtime, and achieve higher output rates while maintaining consistency in quality. Automated systems can significantly improve overall product quality by reducing the margin for human error and increasing precision, earning these companies a reputation for excellence in their respective industries.
Furthermore, as global markets become more interconnected, automation provides the agility and flexibility required to respond quickly to fluctuating demand and dynamic supply chain conditions. This adaptability not only mitigates risks but also capitalizes on new opportunities, strengthening their market position.
Furthermore, as automation advances, these businesses recognize the opportunities for innovation and creative problem-solving that it provides. Automation does not simply replace human labor; rather it supplements it by liberating employees from mundane and repetitive tasks. This shift frees up workers’ expertise, experience, and ingenuity for areas that require a human touch, such as research and development, design, and customer relationship management.
Embracing automation fosters an innovative culture in which employees are encouraged to explore new ideas, experiment with cutting-edge technologies, and propel the company forward. In this regard, automation becomes an enabler of human potential, amplifying the organization’s collective intelligence.
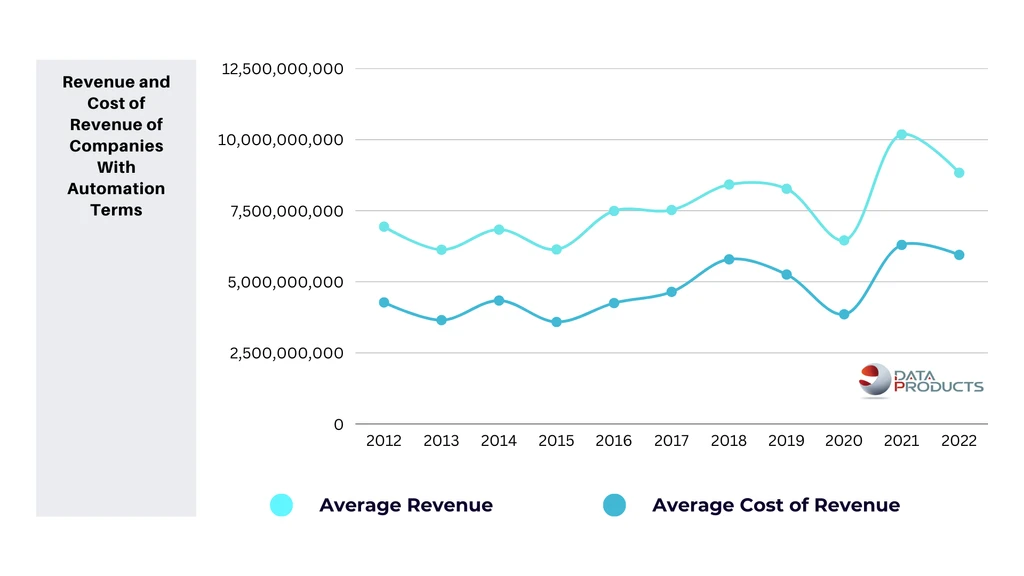
Looking at the revenue and the corresponding cost of revenue during the period where the term “automation” was mentioned, you would notice a consistent revenue growth, with a consistent gap between it and the cost of revenue, given that the gross profit ratio was consistent year on year during that period.
Moving forward, manufacturers must adopt a holistic approach to automation that goes beyond process optimization. Integrating automation into the company’s culture and mindset will be critical, encouraging continuous learning, adaptability, and an entrepreneurial spirit among employees. Collaboration with automation experts, peers in the industry, and research institutions will accelerate the development of cutting-edge technologies and best practices. As automation becomes more prevalent, it is critical to remain aware of its societal impact, proactively addressing workforce transitions, and ensuring equitable benefit distribution.
12. Conclusion: An End and a New Beginning
In conclusion, our research exploring the relationship between technology terms in earning transcripts and financial outcomes has reached a significant milestone. We have explored the language used by companies, as well as the emergence of transformative technologies, and their impact on revenue and stock prices.
The insights gained from analyzing earning transcripts have reinforced the notion that words truly matter in understanding a company’s performance. The transparency, honesty, and long-term thinking conveyed by management through these communications can shape investor perceptions and influence financial outcomes. It is clear that looking beyond the numbers and grasping the narrative behind them is crucial for a comprehensive assessment.
Throughout our study, we examined various technology terms that have emerged as powerful drivers of change. Robotics, with its potential to enhance productivity and profitability, has become increasingly significant across industries. The integration of robotics into operations has proven to be a catalyst for improved efficiency, safety, and precision.
The focus on data-related terms, such as data analytics and big data, has revealed intriguing patterns. In Italy, the insurance sector has showcased a growing maturity in the adoption of advanced analytics, contributing to increased value capture at scale. Meanwhile, China’s intentional prioritization of big data has led to advancements and opportunities across corporate strategies.
The exploration of emerging technologies, including the metaverse and blockchain, has shown immense potential. Meta’s vision for the metaverse as a transformative platform for socializing, working, and creating has captivated attention, while IBM and AMD have positioned themselves as leaders in harnessing the power of blockchain. These technologies can reshape industries and drive innovation, but their true financial impact will manifest as they mature and gain wider market adoption.
While financial metrics are influenced by a variety of factors other than technology, the examination of earnings transcripts and the incorporation of emerging technology terms provide valuable insights into companies’ strategic directions and future performance. Monitoring the interplay between language, technology, and financial outcomes will continue to provide a comprehensive understanding of the opportunities and risks associated with these transformative forces.
Before we conclude, we would like to acknowledge that there are many more directions that we could have taken for this report, such as looking at how individual terms played out over the years, but for the sake of brevity and focus, we have chosen to limit our scope to what we believe to be quite interesting and relevant to prove the reason for this undertaking.
As we conclude this chapter of our research journey, we acknowledge that it marks not just an end but also a new beginning. The insights gained have sparked further questions and avenues for exploration. As technologies evolve and markets adapt, continued analysis and vigilance will be vital in navigating the dynamic landscape of business and finance within the lens of technology.
This image clearly depicts that from 2017 through 2022, there have been a steady decline in AI mentions, but 2023, saw a sharp resurgence in AI-related discussions, most likely due to the rise of Generative AI during the year.
A sectoral breakdown of industry appearances by all terms reveals a prominent concentration within the Technology sector. This segment captures the most mentions, at roughly 160, significantly outpacing the following categories. Business Services occupies the second position with 43 mentions, while Financial Services trails closely behind at 34 mentions. Healthcare and Banking round out the top five, with 32 and 31 mentions respectively. This sectoral distribution underscores the centrality of Technology in the overall business environment, potentially reflecting its role in facilitating operations across various industries.
This chart depicts the companies most frequently mentioned during analyst calls in relation to artificial intelligence (AI). Nvidia emerges as the leader, garnering the most mentions. Meta Platforms (formerly Facebook) follows closely behind in the second position. Accenture, Intuit, and Salesforce round out the top five companies mentioned in these analyst calls. This prevalence suggests that investors and analysts view these companies as being at the forefront of AI development and implementation, potentially shaping the future trajectory of this emerging technology.
This chart reveals a clear hierarchy of AI-related terms, with “Artificial Intelligence” leading the pack at 1535 mentions. “Machine Learning” itself secures the second position at 929 mentions, followed by “Robotics” at 876 mentions. “Deep Learning” and “Autonomous Vehicles” round out the top five at 346 and 121 mentions, respectively.
Average Revenue and Cost of Revenue for Companies with Robotic Mentions Depict a Positive Trajectory. The graph illustrates a trend of increasing average revenue alongside a rising average cost of revenue for companies with mentions of robotics. While the cost of revenue appears to be outpacing revenue growth initially, both metrics appear to be on an upward trajectory by 2022. This suggests that while there may be initial investments required to implement robotics solutions, these companies are also experiencing corresponding growth in revenue, potentially indicating a positive return on investment (ROI) in the long term.
Top Companies By Distribution of Emerging Technology Firms. This chart depicts the distribution of emerging technology firms across various established companies. Meta (formerly Facebook) leads the pack, housing the most emerging technology firms at roughly 60. IBM follows closely behind at 50 , and then AMD with 40. Nvidia and Accenture round out the top five, each with 30. This distribution suggests that Meta is actively integrating emerging technologies into its operations, potentially positioning itself at the forefront of innovation within the tech sector.
Top Countries with Data-Related Keyword Mentions in a McKinsey Report. This chart depicts the countries most frequently mentioned in the context of data-related keywords within a McKinsey report. The United States leads the pack with a significant margin, garnering over 1000 mentions. Italy follows distantly in second place with (22 mentions, followed by China (18 mentions), the United Kingdom (15 mentions), and Switzerland (14 mentions). This distribution highlights the dominance of the United States in data-driven discussions within the McKinsey report, potentially reflecting its leadership in data analytics and data-driven business practices.
Excluding the United States, Italy Leads Countries with Data-Related Keyword Mentions in McKinsey Report. This visualization highlights data-related keyword mentions across a selection of countries, excluding the United States. Italy emerges as the frontrunner, capturing 22 mentions. Italy follows closely behind with 18 mentions, and then the United Kingdom with 15 mentions. Switzerland and Canada round out the top five with 14 and 11 mentions, respectively. This geographic distribution suggests Italy’s prominence in data-driven discussions within this report, potentially indicative of its growing focus on data analytics and data-powered initiatives.
Italian Companies Prioritize Core Data Disciplines: Data Analysis, Big Data, and Data Science Top Terminology Distribution. This chart unveils the distribution of data-related terms used within the context of Italian companies. The analysis reveals a clear focus on fundamental data disciplines, with “Data Analysis” leading the pack at 31 mentions. “Big Data” follows closely behind at 9 mentions, highlighting the growing importance of managing large and complex datasets. “Data Science” secures the third position at 5 mentions, suggesting a rising emphasis on extracting insights from data using advanced techniques. This distribution underscores the focus of Italian companies on core data capabilities, potentially laying the groundwork for more advanced data-driven applications in the future.
Distribution of Data Terms Among Chinese Companies Highlights Focus on Core Competencies. This visualization spotlights the prevalence of various data-related terms used in the context of Chinese companies. The data reveals a potential emphasis on building foundational data capabilities. “Big Data” emerges as the most prominent term, signifying its centrality in Chinese data strategies. Terms like “Data Analysis” and “Data Science” follow closely behind, suggesting a growing focus on managing and harnessing large datasets. This distribution of terms underscores a potential prioritization of establishing a strong data foundation by Chinese companies.
Distribution of Data Terms Among Chinese Companies Highlights Focus on Core Competencies. This visualization spotlights the prevalence of various data-related terms used in the context of Chinese companies. The data reveals a potential emphasis on building foundational data capabilities. “Big Data” emerges as the most prominent term, signifying its centrality in Chinese data strategies. Terms like “Data Analysis” and “Data Science” follow closely behind, suggesting a growing focus on managing and harnessing large datasets. This distribution of terms underscores a potential prioritization of establishing a strong data foundation by Chinese companies.
Distribution of Data Terms Among Chinese Companies Highlights Focus on Core Competencies. This visualization spotlights the prevalence of various data-related terms used in the context of Chinese companies. The data reveals a potential emphasis on building foundational data capabilities. “Big Data” emerges as the most prominent term, signifying its centrality in Chinese data strategies. Terms like “Data Analysis” and “Data Science” follow closely behind, suggesting a growing focus on managing and harnessing large datasets. This distribution of terms underscores a potential prioritization of establishing a strong data foundation by Chinese companies.
A Sectoral Breakdown of US Corporations Reveals Concentration in Traditional Industries. This visual representation emphasizes the dominance of established sectors within the US corporate landscape. The “Financial Services” industry reigns supreme, housing roughly 60 companies, significantly outpacing the following sectors. The “Energy” sector emerges as the second-largest, encompassing 57 companies, while “Retail” trails closely behind at 53 companies. Notably, “Technology” and “Healthcare,” often cited as innovation powerhouses, occupy the fourth and fifth positions, respectively, with 50 and 47 companies. This sectoral distribution highlights the enduring strength of traditional industries in the US corporate landscape, while also acknowledging the presence of influential technology and healthcare sectors.
Cloud Adoption Leads Tech Term Distribution in the United States. This chart depicts the distribution of top technology terms across the United States. “Cloud Computing” reigns supreme, capturing the most mentions at 12,870. “Automation” follows closely behind at 3,682 mentions, highlighting its growing importance in streamlining business processes. “Data Analysis” secures the third position at 1,008 mentions, underscoring the focus on extracting valuable insights from data. “Machine Learning” (826 mentions) and “Robotics” (701 mentions) round out the top five, signifying an increasing emphasis on artificial intelligence and automation. This distribution suggests a strong focus on cloud-based solutions, automation, and data-driven decision making within the United States technology environment.
Logistics and Delivery: The presence of “UPS” in the top five highlights the growing importance of automation within the logistics and delivery sectors, potentially to optimize efficiency and meet rising demand.
Cost of Revenue: The cost of revenue line also increases over time, starting from roughly $4.1 billion in 2012 and reaching approximately $6.0 billion in 2022. This rise likely reflects the initial investments required for automation technologies and infrastructure.

